slice
Volume slice planes
Syntax
Description
slice(draws
slices for the volumetric data X,Y,Z,V,xslice,yslice,zslice) V. Specify
X,Y, and Z as the
coordinate data. Specify xslice, yslice,
and zslice as the slice locations using one of these forms:
To draw one or more slice planes that are orthogonal to a particular axis, specify the slice arguments as a scalar or vector.
To draw a single slice along a surface, specify all the slice arguments as matrices that define a surface.
slice(___,specifies
the interpolation method, where method) method can be
'linear' (the default), 'cubic', or
'nearest'. Use this option with any of the input arguments in
previous syntaxes.
slice( plots into the
specified axes, instead of the current axes (ax,___)gca).
s = slice(___)Surface objects created. slice returns one
Surface object for each slice.
Examples
Show volumetric data along slice planes that are orthogonal to each axis.
Create slice planes through the volume defined by , where x, y, and z range from [-2,2]. Create slice planes orthogonal to the x-axis at the values -1.2, 0.8, and 2 and orthogonal to the z-axis at the value 0. Do not create any slice planes that are orthogonal to the y-axis by specifying an empty array.
[X,Y,Z] = meshgrid(-2:.2:2);
V = X.*exp(-X.^2-Y.^2-Z.^2);

xslice = [-1.2,0.8,2];
yslice = [];
zslice = 0;
slice(X,Y,Z,V,xslice,yslice,zslice)

Show volumetric data along a nonplanar slice. Define the surface where you want to show the volumetric data.
Create volume array V as the volume defined by , where x, y, and z range from [-5,5]. Then, show a slice of the volume data along the surface defined by .
[X,Y,Z] = meshgrid(-5:0.2:5);
V = X.*exp(-X.^2-Y.^2-Z.^2);

[xsurf,ysurf] = meshgrid(-2:0.2:2);
zsurf = xsurf.^2-ysurf.^2;
slice(X,Y,Z,V,xsurf,ysurf,zsurf)

Create a slice plane through volumetric data. Specify the interpolation method for the data values.
Create a slice plane orthogonal to the x-axis at the value 0.8. Since the volume data is not defined for x values of 0.8, the slice function interpolates the nearby values. To use the nearest data point value, specify the interpolation method as 'nearest'.
[X,Y,Z] = meshgrid(-2:2);
V = X.*exp(-X.^2-Y.^2-Z.^2);
xslice = 0.8;
yslice = [];
zslice = [];
slice(X,Y,Z,V,xslice,yslice,zslice,'nearest')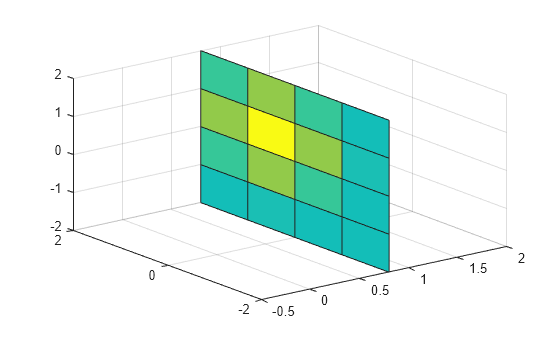
Input Arguments
Extended Capabilities
Version History
Introduced before R2006a
See Also
meshgrid | contourslice | isosurface | interp3 | obliqueslice (Image Processing Toolbox)