streamtube
Create 3-D stream tube plot
Syntax
streamtube(X,Y,Z,U,V,W,startx,starty,startz)

streamtube(U,V,W,startx,starty,startz)

streamtube(vertices,X,Y,Z,divergence)

streamtube(vertices,divergence)

streamtube(vertices,width)

streamtube(vertices)

streamtube(...,[scale n])

streamtube(ax,...)

h = streamtube(...)
Description
streamtube(X,Y,Z,U,V,W,startx,starty,startz)
draws stream tubes from vector volume data U, V, W.
The arrays X, Y, and Z,
which define the coordinates for U, V,
and W, must be monotonic, but do not need to be
uniformly spaced. X, Y, and Z must
have the same number of elements, as if produced by meshgrid.
startx, starty, and startz define the
starting positions of the streamlines at the center of the tubes.
The width of the tubes is proportional to the normalized divergence of the vector field.
streamtube(U,V,W,startx,starty,startz)
assumes X, Y, and Z are
determined by the expression
[X,Y,Z] = meshgrid(1:n,1:m,1:p)
where [m,n,p] = size(U).
streamtube(vertices,X,Y,Z,divergence)
assumes precomputed streamline vertices and divergence. vertices is
a cell array of streamline vertices (as produced by stream3). X, Y, Z,
and divergence are 3-D arrays.
streamtube(vertices,divergence)
assumes X, Y, and Z are
determined by the expression
[X,Y,Z] = meshgrid(1:n,1:m,1:p)
where [m,n,p] = size(divergence).
streamtube(vertices,width)
specifies the width of the tubes in the cell array of vectors, width.
The size of each corresponding element of vertices and width must
be equal. width can also be a scalar, specifying
a single value for the width of all stream tubes.
streamtube(vertices) selects
the width automatically.
streamtube(...,[scale n])
scales the width of the tubes by scale. The default
is scale = 1. When the stream tubes are created,
using start points or divergence, specifying scale = 0 suppresses
automatic scaling. n is the number of points along
the circumference of the tube. The default is n = 20.
streamtube(ax,...) plots into the axes object
ax instead of into the current axes object (gca).
h = streamtube(...) returns a vector of
surface objects (one per start point) used to draw the stream
tubes.
Examples
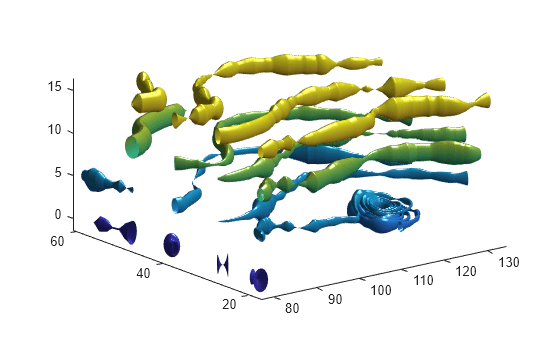
Use the streamtube function to indicate flow in the wind data set. The inputs include the coordinates, vector field components, and starting location for the stream tubes.
load wind
[sx,sy,sz] = meshgrid(80,20:10:50,0:5:15);
streamtube(x,y,z,u,v,w,sx,sy,sz);
view(3);
axis tight
shading interp;
camlight;
lighting gouraud
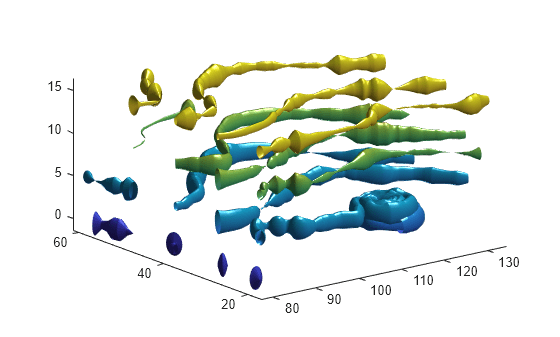
Use vertex data returned by the stream3 function and divergence data to visualize flow.
load wind
[sx,sy,sz] = meshgrid(80,20:10:50,0:5:15);
verts = stream3(x,y,z,u,v,w,sx,sy,sz);
div = divergence(x,y,z,u,v,w);
streamtube(verts,x,y,z,-div);
view(3);
axis tight
shading interp
camlight
lighting gouraud
Extended Capabilities
Version History
Introduced before R2006a