streamline
Plot streamlines from 2-D or 3-D vector data
Syntax
Description
streamline( plots streamlines from
vertices, specified as a cell array of vertex arrays (as returned
by verts)stream2, stream3, or
streamslice).
streamline(___, plots
streamlines using the specified options, defined as a one- or two-element vector with the
form options)step or [step maxvert], where
step is the step size in data units for interpolating the vector data
and maxvert is the maximum number of vertices in a streamline. Use this
argument with any of the input argument combinations from the previous syntaxes.
streamline(___, sets
properties of the streamline plot using one or more name-value arguments. For example, you
can specify the color and thickness of the streamlines. For a list of properties, see
Line Properties. (since R2024b)Name=Value)
streamline( plots
streamlines into the specified axes, instead of into the current axes object
(ax,___)gca).
lineobj = streamline(___)Line objects. Use
lineobj to modify properties of the streamlines after creating them.
For a list of properties, see Line Properties.
Examples
Load the wind data set which contains measurements of air current over regions of North America.
3-D arrays
x,y, andzrepresent the locations of air current measurements.3-D arrays
u,v, andwrepresent the velocity of the air current in 3-D vector fields.
Define the starting position of 16 hypothetical particles. In this case, the particles all start at x = 80 and have starting y positions ranging from 20 to 50 and starting z positions ranging from 0 to 15.
load wind
[startX,startY,startZ] = meshgrid(80,20:10:50,0:5:15);
Compute the 3-D streamline vertex data for a hypothetical particle placed into the air current at the collection of starting positions in startX, startY, and startZ.
verts = stream3(x,y,z,u,v,w,startX,startY,startZ);
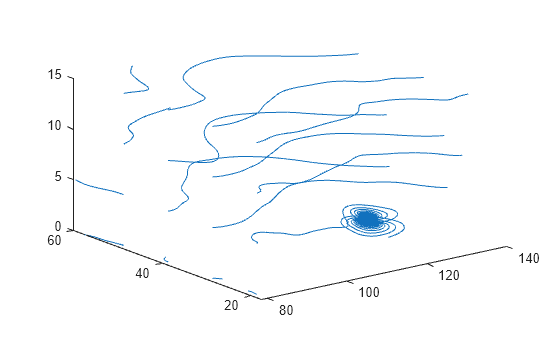
Visualize the 3-D volume of vector fields with streamline. Return the line objects in the variable lineobj, so you can change their properties later.
lineobj = streamline(verts);
view(3)
To change aspects of a particular line, set properties on one of the returned line objects. For example, change the color of the tenth line to green and change its thickness to 3.
lineobj(10).Color = "g";
lineobj(10).LineWidth = 3;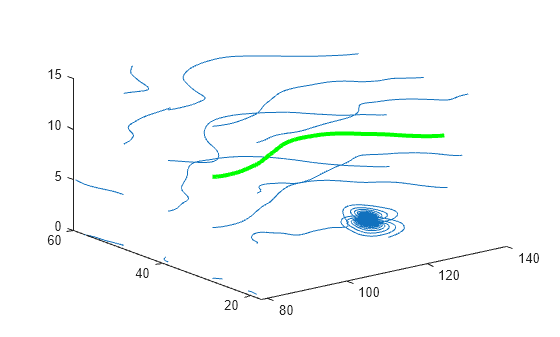
Load the wind data set, which contains measurements of air current over regions of North America.
3-D arrays
xandyrepresent the locations of air current measurements.3-D arrays
uandvrepresent the velocity of the air current in 3-D vector fields.
Use the fifth page of the arrays. Define the starting position of four hypothetical particles. In this case, the four starting locations are (80, 20), (80, 30), (80, 40), and (80, 50).
load wind
x5 = x(:,:,5);
y5 = y(:,:,5);
u5 = u(:,:,5);
v5 = v(:,:,5);
[startX,startY] = meshgrid(80,20:10:50);
Compute the 2-D streamline vertex data for a hypothetical particle placed into the air current with stream2.
verts = stream2(x5,y5,u5,v5,startX,startY);
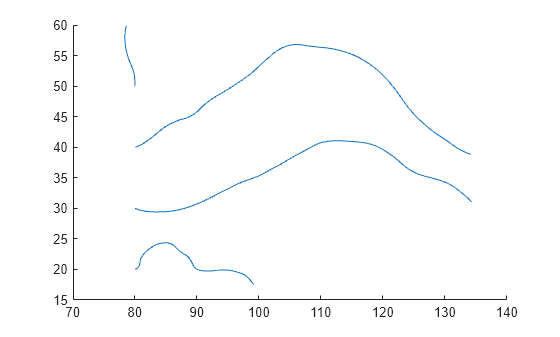
Visualize the 2-D matrix of vector fields by calling streamline. Return the line objects in the variable lineobj, so you can change their properties later.
lineobj = streamline(verts);
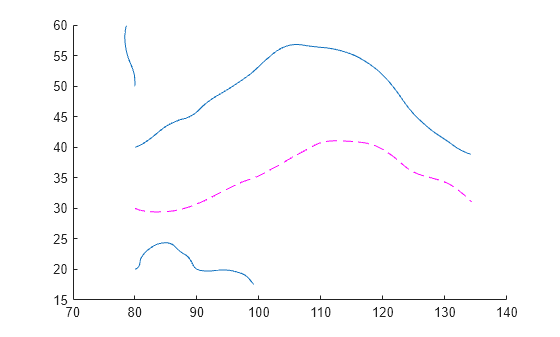
To change aspects of a particular line, set properties on one of the returned line objects. For example, change the color of the second line to magenta and change its style to dashed.
lineobj(2).Color = "m";
lineobj(2).LineStyle = "--";
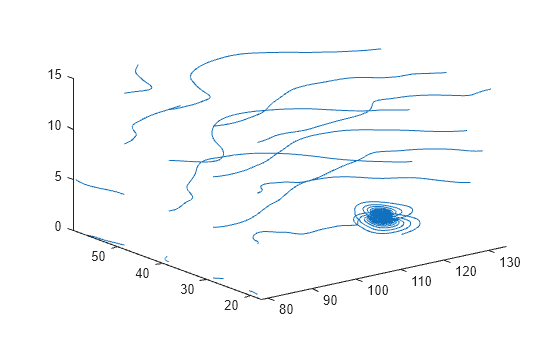
Load the wind dataset and compute the vertices of streamlines that start at evenly spaced points on the plane x = 80. Then, plot the streamlines from the vertex data.
load wind
[startX,startY,startZ] = meshgrid(80,20:10:50,0:5:15);
verts = stream3(x,y,z,u,v,w,startX,startY,startZ);
streamline(verts)
axis tight
view(3);
Input Arguments
Name-Value Arguments
Specify optional pairs of arguments as
Name1=Value1,...,NameN=ValueN, where Name is
the argument name and Value is the corresponding value.
Name-value arguments must appear after other arguments, but the order of the
pairs does not matter.
Example: streamline(verts,LineWidth=2) plots streamlines with a
two-point line thickness.
Note
The properties listed here are only a subset. For a full list, see Line Properties.
Alternatively, you can specify some common colors by name. This table lists the named color options, the equivalent RGB triplets, and the hexadecimal color codes.
| Color Name | Short Name | RGB Triplet | Hexadecimal Color Code | Appearance |
|---|---|---|---|---|
"red" | "r" | [1 0 0] | "#FF0000" |
|
"green" | "g" | [0 1 0] | "#00FF00" |
|
"blue" | "b" | [0 0 1] | "#0000FF" |
|
"cyan"
| "c" | [0 1 1] | "#00FFFF" |
|
"magenta" | "m" | [1 0 1] | "#FF00FF" |
|
"yellow" | "y" | [1 1 0] | "#FFFF00" |
|
"black" | "k" | [0 0 0] | "#000000" |
|
"white" | "w" | [1 1 1] | "#FFFFFF" |
|
"none" | Not applicable | Not applicable | Not applicable | No color |
This table lists the default color palettes for plots in the light and dark themes.
| Palette | Palette Colors |
|---|---|
Before R2025a: Most plots use these colors by default. |
|
|
|
You can get the RGB triplets and hexadecimal color codes for these palettes using the orderedcolors and rgb2hex functions. For example, get the RGB triplets for the "gem" palette and convert them to hexadecimal color codes.
RGB = orderedcolors("gem");
H = rgb2hex(RGB);
Before R2023b: Get the RGB triplets using RGB =
get(groot,"FactoryAxesColorOrder").
Before R2024a: Get the hexadecimal color codes using H =
compose("#%02X%02X%02X",round(RGB*255)).
Line style, specified as one of the options listed in this table.
| Line Style | Description | Resulting Line |
|---|---|---|
"-" | Solid line |
|
"--" | Dashed line |
|
":" | Dotted line |
|
"-." | Dash-dotted line |
|
"none" | No line | No line |
Extended Capabilities
Version History
Introduced before R2006aWhen you create a streamline plot, MATLAB automatically assigns colors and line styles the same way as for most other
plots. For example, the first set of lines created with streamline are
now a soft blue color.

To preserve the appearance from previous releases, use the set
function to set the Color property to [0 0
1].
lineobj = streamline(verts);
set(lineobj,Color=[0 0 1])