stream2
Compute 2-D streamline data
Description
XY = stream2(___,options)step or [step maxvert], where
step is the step size in data units for interpolating the vector data
and maxvert is the maximum number of vertices in a streamline. Use this
argument with any of the input argument combinations from the previous syntaxes.
Examples
Load the wind data set, which contains measurements of air current over regions of North America.
3-D arrays
xandyrepresent the locations of air current measurements.3-D arrays
uandvrepresent the velocity of the air current in 3-D vector fields.
Use the fifth page of the arrays. Define the starting position of four hypothetical particles. In this case, the four starting locations are (80, 20), (80, 30), (80, 40), and (80, 50).
load wind
x5 = x(:,:,5);
y5 = y(:,:,5);
u5 = u(:,:,5);
v5 = v(:,:,5);
[startX,startY] = meshgrid(80,20:10:50);
Compute the 2-D streamline vertex data for a hypothetical particle placed into the air current with stream2.
verts = stream2(x5,y5,u5,v5,startX,startY);
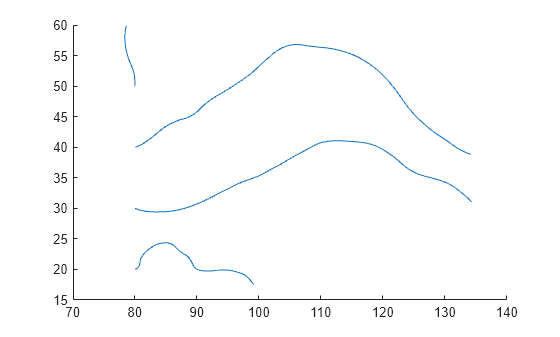
Visualize the 2-D matrix of vector fields by calling streamline. Return the line objects in the variable lineobj, so you can change their properties later.
lineobj = streamline(verts);
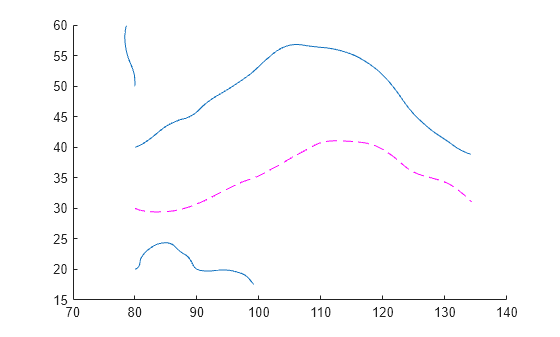
To change aspects of a particular line, set properties on one of the returned line objects. For example, change the color of the second line to magenta and change its style to dashed.
lineobj(2).Color = "m";
lineobj(2).LineStyle = "--";
Load the wind data set, which contains measurements of air current over regions of North America.
3-D arrays
xandyrepresent the locations of air current measurements.3-D arrays
uandvrepresent the velocity of the air current in 3-D vector fields..
Use the fifth page of the arrays. Define the starting position of four hypothetical particles. In this case, the four starting locations are (80, 20), (80, 30), (80, 40), and (80, 50).
load wind
x5 = x(:,:,5);
y5 = y(:,:,5);
u5 = u(:,:,5);
v5 = v(:,:,5);
[startX,startY] = meshgrid(80,20:10:50);
Decrease the streamline resolution by increasing the step size from the default of 0.1 to 3.
step = 3;
Compute the 2-D streamline vertex data for a hypothetical particle placed into the air current with stream2 and step.
verts = stream2(x5,y5,u5,v5,startX,startY,step);
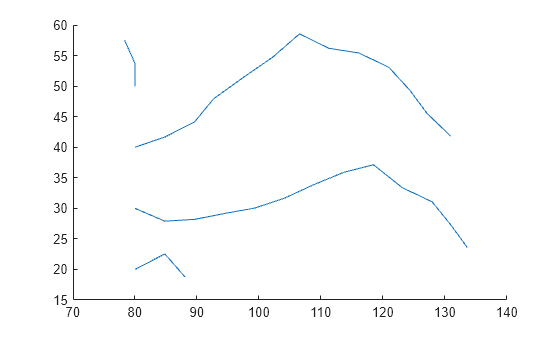
Visualize the 2-D matrix of vector fields with streamline. The larger step size results in a lower resolution streamline.
streamline(verts)
Load the wind data set, which contains measurements of air current over regions of North America.
3-D arrays
xandyrepresent the locations of air current measurements.3-D arrays
uandvrepresent the velocity of the air current in 3-D vector fields.
Use the fifth page of the arrays. Define the starting position of four hypothetical particles. In this case, the four starting locations are (80, 20), (80, 30), (80, 40), and (80, 50).
load wind
x5 = x(:,:,5);
y5 = y(:,:,5);
u5 = u(:,:,5);
v5 = v(:,:,5);
[startX,startY] = meshgrid(80,20:10:50);
Increase the streamline resolution by decreasing the step size from the default of 0.1 to 0.01.
step = 0.01;
Set the maximum number of vertices so that computation ends after the first 1,000 vertices are calculated.
maxvert = 1000;
Compute the 2-D streamline vertex data for a hypothetical particle placed into the air current with stream2, step, and maxvert.
verts = stream2(x5,y5,u5,v5,startX,startY,[step maxvert]);
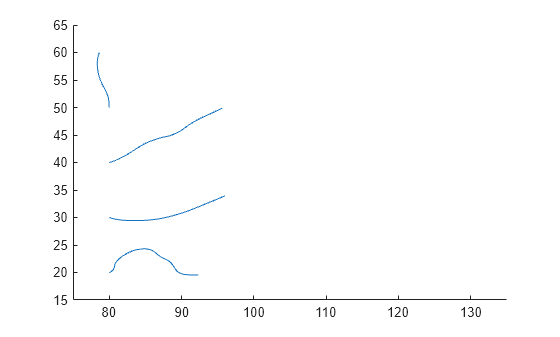
Visualize the 2-D matrix of vector fields with streamline. Show the full range of data values by setting the axis limits. The streamlines end after 1,000 vertices are calculated, so the streamlines stop before showing the full range of data.
streamline(verts)
xlim([75 135])
ylim([15 65])
Input Arguments
Extended Capabilities
Version History
Introduced before R2006a