streamparticles
Plot stream particles
Syntax
Description
streamparticles( plots stream particles
at each vertex of the streamlines of a vector field. Stream particles can show the position
and velocity of a streamline.verts)
streamparticles(___,
modifies stream particle animation and appearance by using one or more name-value arguments
to set properties. For example, you can set the shape of the particles using the
Name,Value)Marker property. Specify name-value arguments after all the arguments
in any of the previous syntaxes. For a list of properties, see Line Properties.
streamparticles( uses
the target object to create the stream particles plot. If the target object is an
target,___)Axes object, then MATLAB® plots into the specified axes instead of the current axes
(gca). If the target object is a Line object, then
the line properties are updated to create the stream particles instead of creating a new
Line object.
lineobj = streamparticles(___)Line object that contains all particle vertices.
Examples
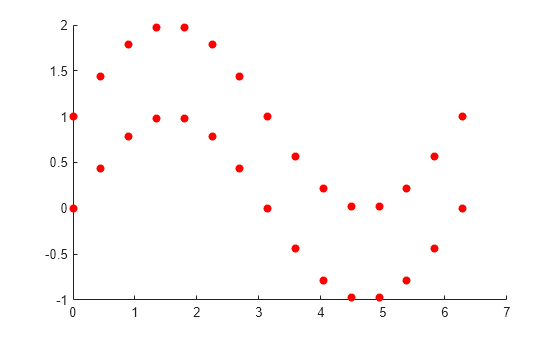
Create vertices for two streamlines, specified as x- and y-coordinates in 15-by-2 matrices. Define the vertex input to streamparticles as a cell array, where each element represents one streamline.
x = linspace(0,2*pi,15);
y1 = sin(x);
y2 = sin(x) + 1;

s1 = [x;y1]';
s2 = [x;y2]';
verts = {s1,s2};
Plot particles at each vertex of the streamlines.
streamparticles(verts);
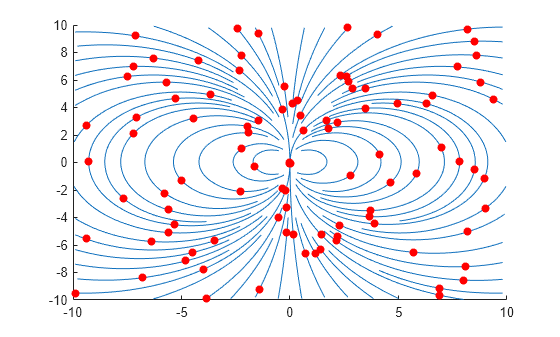
Define a vector field using position and velocity matrices. Use streamslice to generate the vertices of the streamlines in the vector field, and store the vertices in verts.
[x,y] = meshgrid(-10:10);
u = 2.*x.*y;
v = y.^2 - x.^2;
[verts,~] = streamslice(x,y,u,v);
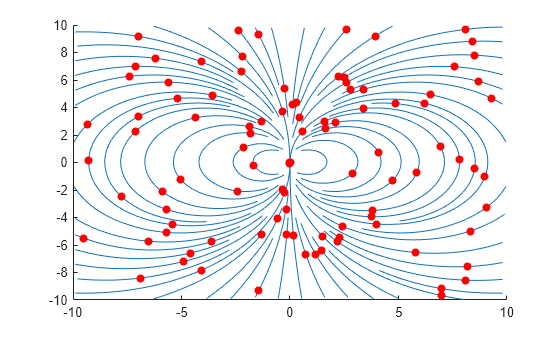
Plot the streamlines with streamline. Then, plot 100 particles with streamparticles. By default, the particles are spaced evenly over all the vertices.
streamline(verts);
streamparticles(verts,100);
For the same vector field, plot five particles evenly over the streamline with the most vertices by setting the ParticleAlignment property to "on". The streamparticles function uses that spacing to plot particles on the remaining streamlines.
streamline(verts);
streamparticles(verts,5,"ParticleAlignment","on");
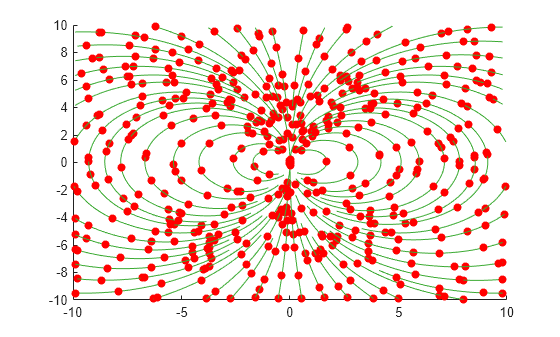
For the same vector field, plot 5% of the streamline vertices as particles.
streamline(verts);
streamparticles(verts,0.05);
Create the vertices for a vector field, and plot its streamlines and stream particles. Animate the particles for five iterations at 30 frames per second by setting the Animate and FrameRate properties, respectively.
[x,y] = meshgrid(-10:10);
u = 2.*x.*y;
v = y.^2 - x.^2;
[verts,~] = streamslice(x,y,u,v);

streamline(verts);
streamparticles(verts,100,"Animate",5,"FrameRate",30);
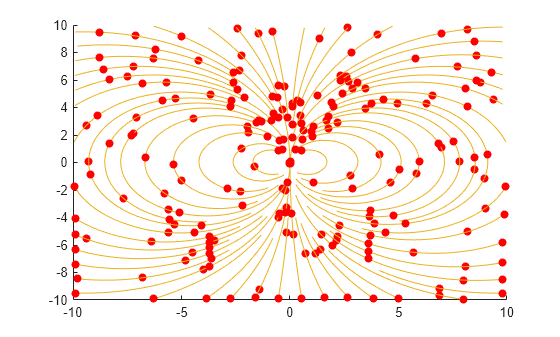
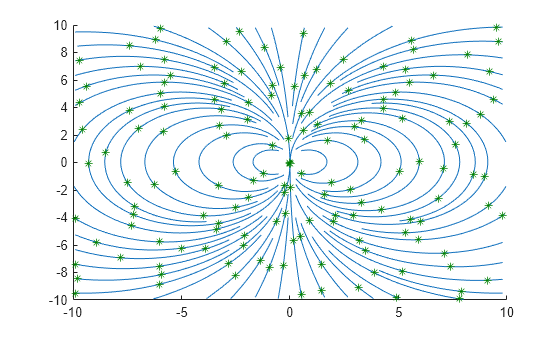
Create the vertices for a vector field, and plot its streamlines and stream particles. Use green asterisk markers for the particles by setting the Marker and MarkerEdgeColor properties.
[x,y] = meshgrid(-10:10);
u = 2.*x.*y;
v = y.^2 - x.^2;
[verts,~] = streamslice(x,y,u,v);

streamline(verts);
streamparticles(verts,150,"Marker","*","MarkerEdgeColor",[0 0.5 0]);
Input Arguments
Name-Value Arguments
Specify optional pairs of arguments as
Name1=Value1,...,NameN=ValueN, where Name is
the argument name and Value is the corresponding value.
Name-value arguments must appear after other arguments, but the order of the
pairs does not matter.
Example: streamparticles(verts,MarkerFaceColor="blue") specifies a
blue marker for the stream particles.
Before R2021a, use commas to separate each name and value, and enclose
Name in quotes.
Example: streamparticles(verts,"MarkerFaceColor","blue") specifies a
blue marker for the stream particles.
Note
The line properties listed here are only a subset of properties that can change particle appearance. For a complete list, see Line Properties.
Number of animation iterations, specified as a nonnegative integer. By default,
the value of Animate is 0, which specifies no
stream particle motion. If the value is Inf, the animation
continues until you press Ctrl+C.
Animation frames per second, specified as a nonnegative integer. By default, the
value of FrameRate is Inf, which draws the
animation as fast as possible given the limitations of the machine running
streamparticles.
Alignment of particles on streamlines, specified as "off" or
"on".
If
ParticleAlignmentis"off",ndetermines the number of particles plotted, evenly spaced over all streamline vertices.If
ParticleAlignmentis"on",ndetermines the number of particles plotted, evenly spaced over the streamline with the most vertices. Thestreamparticlesfunction uses this spacing to plot particles on the remaining streamlines.
Marker symbol, specified as one of the values listed in this table. By default,
particles are displayed as circles. If the marker symbol does not have a face, for
instance, "*", the marker edge color must be specified.
| Marker | Description | Resulting Marker |
|---|---|---|
"o" | Circle |
|
"+" | Plus sign |
|
"*" | Asterisk |
|
"." | Point |
|
"x" | Cross |
|
"_" | Horizontal line |
|
"|" | Vertical line |
|
"square" | Square |
|
"diamond" | Diamond |
|
"^" | Upward-pointing triangle |
|
"v" | Downward-pointing triangle |
|
">" | Right-pointing triangle |
|
"<" | Left-pointing triangle |
|
"pentagram" | Pentagram |
|
"hexagram" | Hexagram |
|
"none" | No markers | Not applicable |
Marker outline color, specified as "none", an RGB triplet, a
hexadecimal color code, a color name, or a short name. By default, there is no marker
outline color.
RGB triplets and hexadecimal color codes are useful for specifying custom colors.
An RGB triplet is a three-element row vector whose elements specify the intensities of the red, green, and blue components of the color. The intensities must be in the range
[0,1]; for example,[0.4 0.6 0.7].A hexadecimal color code is a character vector or a string scalar that starts with a hash symbol (
#) followed by three or six hexadecimal digits, which can range from0toF. The values are not case sensitive. Thus, the color codes"#FF8800","#ff8800","#F80", and"#f80"are equivalent.
Alternatively, you can specify some common colors by name. This table lists the named color options, the equivalent RGB triplets, and hexadecimal color codes.
| Color Name | Short Name | RGB Triplet | Hexadecimal Color Code | Appearance |
|---|---|---|---|---|
"red" | "r" | [1 0 0] | "#FF0000" |
|
"green" | "g" | [0 1 0] | "#00FF00" |
|
"blue" | "b" | [0 0 1] | "#0000FF" |
|
"cyan"
| "c" | [0 1 1] | "#00FFFF" |
|
"magenta" | "m" | [1 0 1] | "#FF00FF" |
|
"yellow" | "y" | [1 1 0] | "#FFFF00" |
|
"black" | "k" | [0 0 0] | "#000000" |
|
"white" | "w" | [1 1 1] | "#FFFFFF" |
|
This table lists the default color palettes for plots in the light and dark themes.
| Palette | Palette Colors |
|---|---|
Before R2025a: Most plots use these colors by default. |
|
|
|
You can get the RGB triplets and hexadecimal color codes for these palettes using the orderedcolors and rgb2hex functions. For example, get the RGB triplets for the "gem" palette and convert them to hexadecimal color codes.
RGB = orderedcolors("gem");
H = rgb2hex(RGB);
Before R2023b: Get the RGB triplets using RGB =
get(groot,"FactoryAxesColorOrder").
Before R2024a: Get the hexadecimal color codes using H =
compose("#%02X%02X%02X",round(RGB*255)).
Marker fill color, specified as "red",
"none", an RGB triplet, a hexadecimal color code, a color name,
or a short name. By default, the marker fill color is red.
RGB triplets and hexadecimal color codes are useful for specifying custom colors.
An RGB triplet is a three-element row vector whose elements specify the intensities of the red, green, and blue components of the color. The intensities must be in the range
[0,1]; for example,[0.4 0.6 0.7].A hexadecimal color code is a character vector or a string scalar that starts with a hash symbol (
#) followed by three or six hexadecimal digits, which can range from0toF. The values are not case sensitive. Thus, the color codes"#FF8800","#ff8800","#F80", and"#f80"are equivalent.
Alternatively, you can specify some common colors by name. This table lists the named color options, the equivalent RGB triplets, and hexadecimal color codes.
| Color Name | Short Name | RGB Triplet | Hexadecimal Color Code | Appearance |
|---|---|---|---|---|
"red" | "r" | [1 0 0] | "#FF0000" |
|
"green" | "g" | [0 1 0] | "#00FF00" |
|
"blue" | "b" | [0 0 1] | "#0000FF" |
|
"cyan"
| "c" | [0 1 1] | "#00FFFF" |
|
"magenta" | "m" | [1 0 1] | "#FF00FF" |
|
"yellow" | "y" | [1 1 0] | "#FFFF00" |
|
"black" | "k" | [0 0 0] | "#000000" |
|
"white" | "w" | [1 1 1] | "#FFFFFF" |
|
This table lists the default color palettes for plots in the light and dark themes.
| Palette | Palette Colors |
|---|---|
Before R2025a: Most plots use these colors by default. |
|
|
|
You can get the RGB triplets and hexadecimal color codes for these palettes using the orderedcolors and rgb2hex functions. For example, get the RGB triplets for the "gem" palette and convert them to hexadecimal color codes.
RGB = orderedcolors("gem");
H = rgb2hex(RGB);
Before R2023b: Get the RGB triplets using RGB =
get(groot,"FactoryAxesColorOrder").
Before R2024a: Get the hexadecimal color codes using H =
compose("#%02X%02X%02X",round(RGB*255)).
Extended Capabilities
Version History
Introduced before R2006a