streamribbon
3-D stream ribbon plot from vector volume data
Syntax
streamribbon(X,Y,Z,U,V,W,startx,starty,startz)

streamribbon(U,V,W,startx,starty,startz)

streamribbon(vertices,X,Y,Z,cav,speed)

streamribbon(vertices,cav,speed)

streamribbon(vertices,twistangle)

streamribbon(...,width)

streamribbon(axes_handle,...)

h = streamribbon(...)
Description
streamribbon(X,Y,Z,U,V,W,startx,starty,startz)
draws stream ribbons from vector volume data U, V, W.
The arrays X, Y, and Z,
which define the coordinates for U, V,
and W, must be monotonic, but do not need to be
uniformly spaced. X, Y, and Z must
have the same number of elements, as if produced by meshgrid.
startx, starty, and startz define the
starting positions of the stream ribbons at the center of the ribbons.
The twist of the ribbons is proportional to the curl of the vector field. The width of the ribbons is calculated automatically.
streamribbon(U,V,W,startx,starty,startz)
assumes X, Y, and Z are
determined by the expression
[X,Y,Z] = meshgrid(1:n,1:m,1:p)
where [m,n,p] = size(U).
streamribbon(vertices,X,Y,Z,cav,speed)
assumes precomputed streamline vertices, curl angular velocity, and
flow speed. vertices is a cell array of streamline
vertices (as produced by stream3). X, Y, Z, cav,
and speed are 3-D arrays.
streamribbon(vertices,cav,speed)
assumes X, Y, and Z are
determined by the expression
[X,Y,Z] = meshgrid(1:n,1:m,1:p)
where [m,n,p] = size(cav).
streamribbon(vertices,twistangle)
uses the cell array of vectors twistangle for the
twist of the ribbons (in radians). The size of each corresponding
element of vertices and twistangle must
be equal.
streamribbon(...,width)
sets the width of the ribbons to width.
streamribbon(axes_handle,...)
plots into the axes object with the handle axes_handle instead
of into the current axes object (gca).
h = streamribbon(...)
returns a vector of handles (one per start point) to surface objects.
Examples
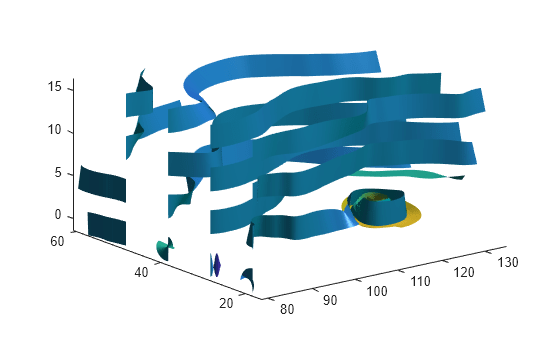
Use stream ribbons to indicate the flow in a data set.
load wind
[sx,sy,sz] = meshgrid(80,20:10:50,0:5:15);
streamribbon(x,y,z,u,v,w,sx,sy,sz);
axis tight
shading interp
view(3);
camlight
lighting gouraud
Use precalculated vertex data, curl average velocity, and speed to indicate flow.
load wind
[sx,sy,sz] = meshgrid(80,20:10:50,0:5:15);
verts = stream3(x,y,z,u,v,w,sx,sy,sz);
cav = curl(x,y,z,u,v,w);
spd = sqrt(u.^2 + v.^2 + w.^2).*.1;
streamribbon(verts,x,y,z,cav,spd);
axis tight
shading interp
view(3);
camlight;
lighting gouraud
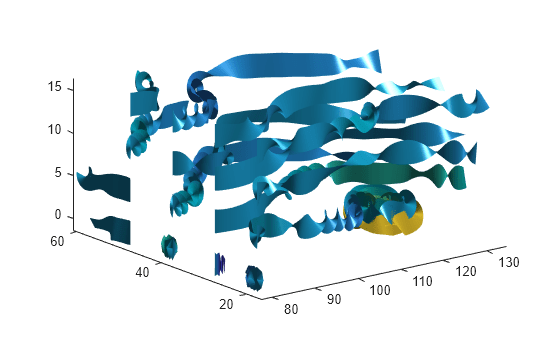
Using precalculated data enables you to use values other than those calculated from the single data source. In this case, the speed is reduced by a factor of 10 compared to the previous example.
Specify a twist angle for the stream ribbon
t = 0:.15:15;
verts = {[cos(t)' sin(t)' (t/3)']};
twistangle = {cos(t)'};
streamribbon(verts,twistangle);
axis tight
shading interp
view(3)
camlight
lighting gouraud
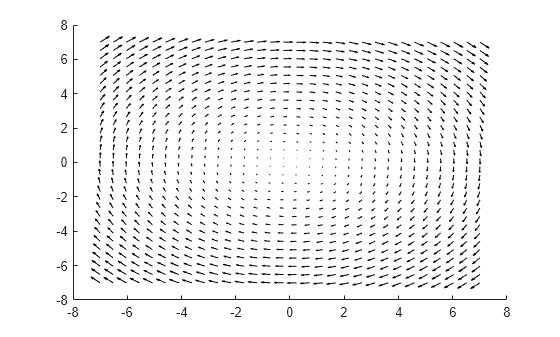
Create 3-D arrays and a cone plot.
xmin = -7; xmax = 7;
ymin = -7; ymax = 7;
zmin = -7; zmax = 7;
x = linspace(xmin,xmax,30);
y = linspace(ymin,ymax,20);
z = linspace(zmin,zmax,20);
[x,y,z] = meshgrid(x,y,z);
u = y;
v = -x;
w = 0*x+1;
[cx,cy,cz] = meshgrid(linspace(xmin,xmax,30),...
   linspace(ymin,ymax,30),[-3 4]);
h = coneplot(x,y,z,u,v,w,cx,cy,cz,'quiver');
set(h,'Color','k');
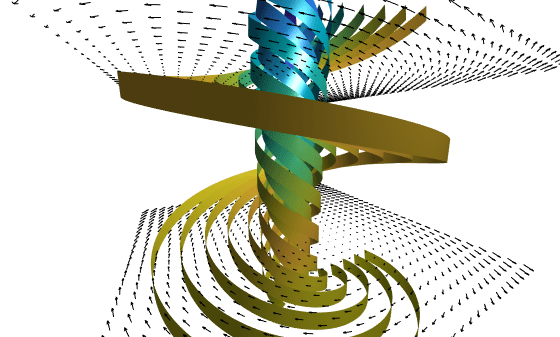
Plot two sets of stream ribbons. Then define the view and lighting.
[sx,sy,sz] = meshgrid([-1 0 1],[-1 0 1],-6);
streamribbon(x,y,z,u,v,w,sx,sy,sz);
[sx,sy,sz] = meshgrid([1:6],[0],-6);
streamribbon(x,y,z,u,v,w,sx,sy,sz);
shading interp
view(-30,10)
axis off tight
camproj perspective
camva(66)
camlookat
camdolly(0,0,.5,'fixtarget')
camlight
Extended Capabilities
Version History
Introduced before R2006a