Main Content

findgroups

Find groups and return group numbers

Description

To split data into groups and apply a function to the groups, use the findgroups and splitapply functions together. For more information about calculations on groups of data, see Calculations on Groups of Data.

example

G = findgroups(A) returns G, a vector of group numbers created from the grouping variable A. The output argument G contains integer values from 1 to N, indicating N distinct groups for the N unique values in A. For example, if A is ["b","a","a","b"], then findgroups returns G as [2 1 1 2].

To use G to split groups of data out of other variables, pass it as an input argument to the splitapply function.

The findgroups function treats empty character vectors and NaN, NaT, and undefined categorical values in A as missing values and returns NaN as the corresponding elements of G.

example

G = findgroups(A1,...,AN) creates group numbers from A1,...,AN. The findgroups function defines groups as the unique combinations of values across A1,...,AN. For example, if A1 is ["a","a","b","b"] and A2 is [0 1 0 0], then findgroups(A1,A2) returns G as [1 2 3 3], because the combination "b" 0 occurs twice.

example

[G,ID] = findgroups(A) also returns the unique values for each group in ID. For example, if A is ["b","a","a","b"], then findgroups returns G as [2 1 1 2] and ID as ["a","b"]. The arguments A and ID are the same data type, but need not be the same size.

example

[G,ID1,...,IDN] = findgroups(A1,...,AN) also returns the unique values for each group across ID1,...,IDN. The values across ID1,...,IDN define the groups. For example, if A1 is ["a","a","b","b"] and A2 is [0 1 0 0], then findgroups(A1,A2) returns G as [1 2 3 3], and ID1 and ID2 as ["a","a","b"] and [0 1 0].

example

G = findgroups(T) returns G, a vector of group numbers created from the variables in table T. The findgroups function treats all the variables in T as grouping variables.

example

[G,TID] = findgroups(T) also returns TID, a table that contains the unique values for each group. TID contains the unique combinations of values across the variables of T. The variables in T and TID have the same names, but the tables need not have the same number of rows.

Examples

collapse all

Use group numbers to split patient weight measurements into groups of weights for smokers and nonsmokers. Then calculate the mean weight for each group of patients.

Load patient data from the sample file patients.mat.

load patients
whos Smoker Weight
  Name          Size            Bytes  Class      Attributes

  Smoker      100x1               100  logical              
  Weight      100x1               800  double               

Specify groups with findgroups. Each element of G is a group number that specifies which group a patient is in. Group 1 contains nonsmokers and group 2 contains smokers.

G = findgroups(Smoker)
G = 100×1

     2
     1
     1
     1
     1
     1
     2
     1
     1
     1
      ⋮

Display the weights of the patients.

Weight
Weight = 100×1

   176
   163
   131
   133
   119
   142
   142
   180
   183
   132
      ⋮

Split the Weight array into two groups of weights using G. Apply the mean function. The mean weight of the nonsmokers is a bit less than the mean weight of the smokers.

meanWeights = splitapply(@mean,Weight,G)
meanWeights = 2×1

  149.9091
  161.9412

Calculate mean weights for groups of patients. In this case, group patients by their statuses as smokers or nonsmokers, and by the hospitals where they were seen. There are three hospitals in the data set, so there are six groups of patients.

Load hospital locations, smoker status, and weights for patients from the sample file patients.mat.

load patients
whos Location Smoker Weight
  Name            Size            Bytes  Class      Attributes

  Location      100x1             14208  cell                 
  Smoker        100x1               100  logical              
  Weight        100x1               800  double               

Display the Location and Smoker arrays.

Location
Location = 100x1 cell
    {'County General Hospital'  }
    {'VA Hospital'              }
    {'St. Mary's Medical Center'}
    {'VA Hospital'              }
    {'County General Hospital'  }
    {'St. Mary's Medical Center'}
    {'VA Hospital'              }
    {'VA Hospital'              }
    {'St. Mary's Medical Center'}
    {'County General Hospital'  }
    {'County General Hospital'  }
    {'St. Mary's Medical Center'}
    {'VA Hospital'              }
    {'VA Hospital'              }
    {'St. Mary's Medical Center'}
    {'VA Hospital'              }
    {'St. Mary's Medical Center'}
    {'VA Hospital'              }
    {'County General Hospital'  }
    {'County General Hospital'  }
    {'VA Hospital'              }
    {'VA Hospital'              }
    {'VA Hospital'              }
    {'County General Hospital'  }
    {'County General Hospital'  }
    {'VA Hospital'              }
    {'VA Hospital'              }
    {'County General Hospital'  }
    {'County General Hospital'  }
    {'County General Hospital'  }
      ⋮

Smoker
Smoker = 100x1 logical array

   1
   0
   0
   0
   0
   0
   1
   0
   0
   0
      ⋮

Specify groups using locations and smoker status. G contains integers from one to six because there are six possible combinations of values from Smoker and Location.

G = findgroups(Location,Smoker)
G = 100×1

     2
     5
     3
     5
     1
     3
     6
     5
     3
     1
      ⋮

Calculate the mean weight for each group. There is less variation by location than by status as a smoker.

meanWeights = splitapply(@mean,Weight,G)
meanWeights = 6×1

  150.1739
  159.8125
  146.8947
  158.4000
  152.0417
  165.9231

Calculate the mean weights for groups of patients and display the results in a table. To associate the mean weights with group IDs, use the second output argument from findgroups.

Load patient weights and smoker statuses from the sample file patients.mat.

load patients
whos Smoker Weight
  Name          Size            Bytes  Class      Attributes

  Smoker      100x1               100  logical              
  Weight      100x1               800  double               

Specify groups using findgroups. The values in the output argument ID are labels for the groups that findgroups finds in the grouping variable.

[G,ID] = findgroups(Smoker)
G = 100×1

     2
     1
     1
     1
     1
     1
     2
     1
     1
     1
      ⋮

ID = 2x1 logical array

   0
   1

Calculate the mean weights. Create a table that contains the mean weights.

meanWeight = splitapply(@mean,Weight,G);
T = table(ID,meanWeight,'VariableNames',["Smokers","Mean Weights"])
T=2×2 table
    Smokers    Mean Weights
    _______    ____________

     false        149.91   
     true         161.94   

Calculate mean weights for groups of patients and display the results in a table. In this case, group patients by their statuses as smokers or nonsmokers, and by the hospitals where they were seen.

Load hospital locations, smoker status, and weights for patients from the sample file patients.mat.

load patients
whos Location Smoker Weight
  Name            Size            Bytes  Class      Attributes

  Location      100x1             14208  cell                 
  Smoker        100x1               100  logical              
  Weight        100x1               800  double               

Convert Location to a string array. Then specify groups using locations and smoker status. You can specify two group IDs as additional outputs because you specify two grouping variables as inputs. There are six possible combinations of locations and smoker status. Together ID1 and ID2 provide IDs for the six groups.

Location = string(Location);
[G,ID1,ID2] = findgroups(Location,Smoker)
G = 100×1

     2
     5
     3
     5
     1
     3
     6
     5
     3
     1
      ⋮

ID1 = 6x1 string
    "County General Hospital"
    "County General Hospital"
    "St. Mary's Medical Center"
    "St. Mary's Medical Center"
    "VA Hospital"
    "VA Hospital"

ID2 = 6x1 logical array

   0
   1
   0
   1
   0
   1

Calculate the mean weight for each group.

meanWeights = splitapply(@mean,Weight,G)
meanWeights = 6×1

  150.1739
  159.8125
  146.8947
  158.4000
  152.0417
  165.9231

Create a table with the mean weight for each group of patients.

T = table(ID1,ID2,meanWeights,'VariableNames',["Hospital","Smoker","Mean Weight"])
T=6×3 table
             Hospital              Smoker    Mean Weight
    ___________________________    ______    ___________

    "County General Hospital"      false       150.17   
    "County General Hospital"      true        159.81   
    "St. Mary's Medical Center"    false       146.89   
    "St. Mary's Medical Center"    true         158.4   
    "VA Hospital"                  false       152.04   
    "VA Hospital"                  true        165.92   

Calculate mean weights for patients using grouping variables that are in a table.

Load hospital locations and smoking statuses for 100 patients into a table.

load patients
T = table(Location,Smoker)
T=100×2 table
              Location               Smoker
    _____________________________    ______

    {'County General Hospital'  }    true  
    {'VA Hospital'              }    false 
    {'St. Mary's Medical Center'}    false 
    {'VA Hospital'              }    false 
    {'County General Hospital'  }    false 
    {'St. Mary's Medical Center'}    false 
    {'VA Hospital'              }    true  
    {'VA Hospital'              }    false 
    {'St. Mary's Medical Center'}    false 
    {'County General Hospital'  }    false 
    {'County General Hospital'  }    false 
    {'St. Mary's Medical Center'}    false 
    {'VA Hospital'              }    false 
    {'VA Hospital'              }    true  
    {'St. Mary's Medical Center'}    false 
    {'VA Hospital'              }    true  
      ⋮

Specify groups of patients using the Smoker and Location variables in T.

G = findgroups(T)
G = 100×1

     2
     5
     3
     5
     1
     3
     6
     5
     3
     1
      ⋮

Calculate mean weights from the data array Weight.

meanWeights = splitapply(@mean,Weight,G)
meanWeights = 6×1

  150.1739
  159.8125
  146.8947
  158.4000
  152.0417
  165.9231

Create a table of mean weights for patients grouped by hospital location and status as a smoker or nonsmoker.

Load locations and smoking statuses for patients into a table. Convert Location to a string array.

load patients
Location = string(Location);
T = table(Location,Smoker)
T=100×2 table
             Location              Smoker
    ___________________________    ______

    "County General Hospital"      true  
    "VA Hospital"                  false 
    "St. Mary's Medical Center"    false 
    "VA Hospital"                  false 
    "County General Hospital"      false 
    "St. Mary's Medical Center"    false 
    "VA Hospital"                  true  
    "VA Hospital"                  false 
    "St. Mary's Medical Center"    false 
    "County General Hospital"      false 
    "County General Hospital"      false 
    "St. Mary's Medical Center"    false 
    "VA Hospital"                  false 
    "VA Hospital"                  true  
    "St. Mary's Medical Center"    false 
    "VA Hospital"                  true  
      ⋮

Specify groups of patients using the Location and Smoker variables in T. The output table TID identifies the groups.

[G,TID] = findgroups(T);
TID
TID=6×2 table
             Location              Smoker
    ___________________________    ______

    "County General Hospital"      false 
    "County General Hospital"      true  
    "St. Mary's Medical Center"    false 
    "St. Mary's Medical Center"    true  
    "VA Hospital"                  false 
    "VA Hospital"                  true  

Calculate mean weights from the data array Weight. Append the mean weights to TID.

TID.meanWeight = splitapply(@mean,Weight,G)
TID=6×3 table
             Location              Smoker    meanWeight
    ___________________________    ______    __________

    "County General Hospital"      false       150.17  
    "County General Hospital"      true        159.81  
    "St. Mary's Medical Center"    false       146.89  
    "St. Mary's Medical Center"    true         158.4  
    "VA Hospital"                  false       152.04  
    "VA Hospital"                  true        165.92  

Input Arguments

collapse all

Grouping variable, specified as a vector. The unique values in A identify groups. You can specify grouping variables using the data types listed in the table.

Values That Specify Groups

Data Type of Grouping Variable

Numbers

Numeric or logical vector

Text

String array or cell array of character vectors

Dates and times

datetime, duration, or calendarDuration vector

Categories

categorical vector

Bins

Vector of binned values, created by binning a continuous distribution of numeric, datetime, or duration values

Grouping variables, specified as a table. findgroups treats each table variable as a separate grouping variable.

A table variable can be a numeric, logical, string, categorical, datetime, duration, or calendarDuration vector, or a cell array of character vectors.

Output Arguments

collapse all

Group numbers, returned as a vector of positive integers. For N groups identified in the grouping variables, every integer between 1 and N specifies a group. G contains NaN where any grouping variable contains a missing string, an empty character vector, a NaN, NaT, or undefined categorical value.

  • If the grouping variables are vectors, then G and the grouping variables all are the same size.

  • If the grouping variables are in a table, the length of G is equal to the number of rows of the table.

Values that identify each group, returned as a vector of sorted unique values from the input argument A. The data type of ID is the same as the data type of A.

The unique values that identify each group, returned as a table. The variables of TID have the sorted unique values from the corresponding variables of T. However, TID and T need not have the same number of rows.

More About

collapse all

Calculations on Groups of Data

In data analysis, you commonly perform calculations on groups of data. For such calculations, you split one or more data variables into groups of data, perform a calculation on each group, and combine the results into one or more output variables. You can specify the groups using one or more grouping variables. The unique values in the grouping variables define the groups that the corresponding values of the data variables belong to.

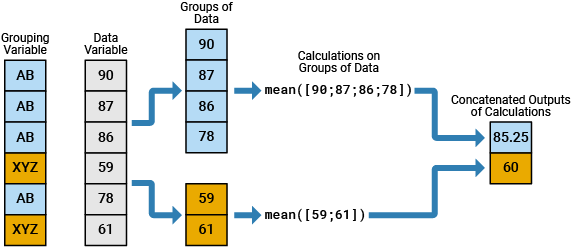
For example, the diagram shows a simple grouped calculation that splits a 6-by-1 numeric vector into two groups of data, calculates the mean of each group, and then combines the outputs into a 2-by-1 numeric vector. The 6-by-1 grouping variable has two unique values, AB and XYZ.

Calculation that splits a data variable based on a grouping variable, performs calculations on individual groups of data by applying the same function, and then concatenates the outputs of those function calls

You can specify grouping variables that have numbers, text, dates and times, categories, or bins.

Extended Capabilities

Version History

Introduced in R2015b