Main Content

splitapply

Split data into groups and apply function

Description

To split data into groups and apply a function to the groups, use the findgroups and splitapply functions together. For more information about calculations on groups of data, see Calculations on Groups of Data.

example

Y = splitapply(func,X,G) splits X into groups specified by G and applies the function func to each group. Then splitapply returns Y as an array that contains the concatenated outputs from func for the groups split out of X. The input argument G is a vector of positive integers that specifies the groups to which corresponding elements of X belong. If G contains NaN values, splitapply omits the corresponding values in X when it splits X into groups.

To create G, first use the findgroups function. Then use splitapply.

example

Y = splitapply(func,X1,...,XN,G) splits X1,...,XN into groups and applies func. The splitapply function calls func once per group, with corresponding elements from X1,...,XN as the N input arguments to func.

example

Y = splitapply(func,T,G) splits variables of table T into groups and applies func. The splitapply function treats the variables of T as vectors, matrices, or cell arrays, depending on the data types of the table variables. If T has N variables, then func must accept N input arguments.

example

[Y1,...,YM] = splitapply(___) splits variables into groups and applies func to each group. func returns multiple output arguments. Y1,...,YM contains the concatenated outputs from func for the groups split out of the input data variables. func can return output arguments that belong to different classes, but the class of each output must be the same each time func is called. You can use this syntax with any of the input arguments of the previous syntaxes.

The number of output arguments from func need not be the same as the number of input arguments specified by X1,...,XN.

Examples

collapse all

Use group numbers to split patient weight measurements into groups of weights for smokers and nonsmokers. Then calculate the mean weight for each group of patients.

Load patient data from the sample file patients.mat.

load patients
whos Smoker Weight
  Name          Size            Bytes  Class      Attributes

  Smoker      100x1               100  logical              
  Weight      100x1               800  double               

Specify groups with findgroups. Each element of G is a group number that specifies which group a patient is in. Group 1 contains nonsmokers and group 2 contains smokers.

G = findgroups(Smoker)
G = 100×1

     2
     1
     1
     1
     1
     1
     2
     1
     1
     1
      ⋮

Display the weights of the patients.

Weight
Weight = 100×1

   176
   163
   131
   133
   119
   142
   142
   180
   183
   132
      ⋮

Split the Weight array into two groups of weights using G. Apply the mean function. The mean weight of the nonsmokers is a bit less than the mean weight of the smokers.

meanWeights = splitapply(@mean,Weight,G)
meanWeights = 2×1

  149.9091
  161.9412

Calculate the variances of the differences in blood pressure readings for groups of patients, and display the results. The blood pressure readings are contained in two data variables. To calculate the differences, use a function that takes two input arguments.

Load blood pressure readings and smoking data for 100 patients from the data file patients.mat.

load patients
whos Systolic Diastolic Smoker
  Name             Size            Bytes  Class      Attributes

  Diastolic      100x1               800  double               
  Smoker         100x1               100  logical              
  Systolic       100x1               800  double               

Define func as a function that calculates the variances of the differences between systolic and diastolic blood-pressure readings for smokers and nonsmokers. func requires two input arguments.

func = @(x,y) var(x-y)
func = function_handle with value:
    @(x,y)var(x-y)

Use findgroups and splitapply to split the patient data into groups and calculate the variances of the differences. findgroups also returns group identifiers in smokers. The splitapply function calls func once per group, with Systolic and Diastolic as the two input arguments.

[G,smokers] = findgroups(Smoker);
varBP = splitapply(func,Systolic,Diastolic,G)
varBP = 2×1

   44.4459
   48.6783

Create a table that contains the variances of the differences, with the number of patients in each group.

numPatients = splitapply(@numel,Smoker,G);
T = table(smokers,numPatients,varBP)
T=2×3 table
    smokers    numPatients    varBP 
    _______    ___________    ______

     false         66         44.446
     true          34         48.678

Calculate the minimum, median, and maximum weights for groups of patients and return these results as arrays for each group. splitapply concatenates the output arguments so that you can distinguish output for each group from output for the other groups.

Define a function that returns the minimum, median, and maximum as a row vector.

mystats = @(x)[min(x) median(x) max(x)]
mystats = function_handle with value:
    @(x)[min(x),median(x),max(x)]

Load patient weights, hospital locations, and statuses as smokers from the sample file patients.mat.

load patients
whos Weight Location Smoker
  Name            Size            Bytes  Class      Attributes

  Location      100x1             14208  cell                 
  Smoker        100x1               100  logical              
  Weight        100x1               800  double               

Use findgroups and splitapply to split the patient weights into groups and calculate statistics for each group.

G = findgroups(Location,Smoker);
Y = splitapply(mystats,Weight,G)
Y = 6×3

  111.0000  137.0000  194.0000
  120.0000  170.5000  189.0000
  118.0000  134.0000  189.0000
  115.0000  170.0000  191.0000
  117.0000  140.0000  189.0000
  126.0000  178.0000  202.0000

In this example, you can return nonscalar output as row vectors because the data and grouping variables are column vectors. Each row of Y contains statistics for a different group of patients.

Calculate the mean body-mass-index (BMI) from tables of patient data. Group the patients by hospital locations and statuses as smokers or nonsmokers.

Load patient data and grouping variables from the sample file patients.mat into tables. (Convert the hospital locations to a string array.)

load patients
DT = table(Height,Weight);
Location = string(Location);
GT = table(Location,Smoker);

Define a function that calculates mean BMI from the weights and heights of groups or patients.

meanBMIFcn = @(h,w)mean((w ./ (h.^2)) * 703)
meanBMIFcn = function_handle with value:
    @(h,w)mean((w./(h.^2))*703)

Create a table that contains the mean BMI for each group.

[G,results] = findgroups(GT);
meanBMI = splitapply(meanBMIFcn,DT,G);
results.meanBMI = meanBMI
results=6×3 table
             Location              Smoker    meanBMI
    ___________________________    ______    _______

    "County General Hospital"      false     23.774 
    "County General Hospital"      true      24.865 
    "St. Mary's Medical Center"    false     22.968 
    "St. Mary's Medical Center"    true      24.905 
    "VA Hospital"                  false     23.946 
    "VA Hospital"                  true      24.227 

Calculate the minimum, mean, and maximum weights for groups of patients and return results in a table.

Load patient data into a table.

load patients
T = table(Smoker,Weight)
T=100×2 table
    Smoker    Weight
    ______    ______

    true       176  
    false      163  
    false      131  
    false      133  
    false      119  
    false      142  
    true       142  
    false      180  
    false      183  
    false      132  
    false      128  
    false      137  
    false      174  
    true       202  
    false      129  
    true       181  
      ⋮

Group patient weights by smoker status. The attached supporting function, multiStats, returns the minimum, mean, and maximum values from an input array as three outputs. Apply multiStats to the smokers and nonsmokers. Create a table that contains the outputs from multiStats for each group.

[G,smoker] = findgroups(T.Smoker);
[minWeight,meanWeight,maxWeight] = splitapply(@multiStats,T.Weight,G);
result = table(smoker,minWeight,meanWeight,maxWeight)
result=2×4 table
    smoker    minWeight    meanWeight    maxWeight
    ______    _________    __________    _________

    false        111         149.91         194   
    true         115         161.94         202   

function [lo,avg,hi] = multiStats(x)
    lo = min(x);
    avg = mean(x);
    hi = max(x);
end

Input Arguments

collapse all

Function to apply to groups of data, specified as a function handle.

If func returns a nonscalar output argument, then the argument must be oriented so that splitapply can concatenate the output arguments from successive calls to func. For example, if the input data variables are column vectors, then func must return either a scalar or a row vector as an output argument.

Example: Y = splitapply(@sum,X,G) returns the sums of the groups of data in X.

Data variable, specified as a vector, matrix, or cell array. The elements of X belong to groups specified by the corresponding elements of G.

If X is a matrix, splitapply treats each column or row as a separate data variable. The orientation of G determines whether splitapply treats the columns or rows of X as data variables.

Group numbers, specified as a vector of positive integers.

  • If X is a vector or cell array, then G must be the same length as X.

  • If X is a matrix, then the length of G must be equal to the number of columns or rows of X, depending on the orientation of G.

  • If the input argument is table T, then G must be a column vector. The length of G must be equal to the number of rows of T.

Data variables, specified as a table. splitapply treats each table variable as a separate data variable.

More About

collapse all

Calculations on Groups of Data

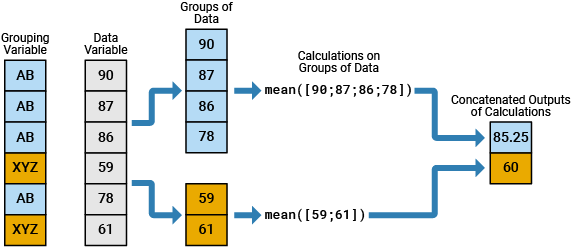
In data analysis, you commonly perform calculations on groups of data. For such calculations, you split one or more data variables into groups of data, perform a calculation on each group, and combine the results into one or more output variables. You can specify the groups using one or more grouping variables. The unique values in the grouping variables define the groups that the corresponding values of the data variables belong to.

For example, the diagram shows a simple grouped calculation that splits a 6-by-1 numeric vector into two groups of data, calculates the mean of each group, and then combines the outputs into a 2-by-1 numeric vector. The 6-by-1 grouping variable has two unique values, AB and XYZ.

Calculation that splits a data variable based on a grouping variable, performs calculations on individual groups of data by applying the same function, and then concatenates the outputs of those function calls

You can specify grouping variables that have numbers, text, dates and times, categories, or bins.

Extended Capabilities

Version History

Introduced in R2015b