rticklabels
Set or query r-axis tick labels
Syntax
Description
rticklabels( sets the
r-axis tick labels for the current axes. Specify
labels)labels as a string array or a cell array of character
vectors; for example, {'January','February','March'}. If you
specify the labels, then the r-axis tick values and tick
labels no longer update automatically based on changes to the axes.
rl = rticklabels
rticklabels('auto') sets an automatic mode,
enabling the axes to determine the r-axis tick
labels. Use this option if you set the labels and then want to set
them back to the default values.
rticklabels('manual') sets a manual mode,
freezing the r-axis tick labels at the current
values.
m = rticklabels('mode')'auto' or 'manual'.
By default, the mode is automatic unless you specify the tick labels
or set the mode to manual.
Examples
Specify r-Axis Tick Values and Labels
Create a polar plot. Display tick marks and grid lines along the r-axis at the values 0.1, 0.3, and 0.5. Then, specify a label for each tick mark.
theta = linspace(0,2*pi);
rho = theta/10;
polarplot(theta,rho)
rticks([0.1 0.25 0.5])
rticklabels({'r = .1','r = .3','r = .5'})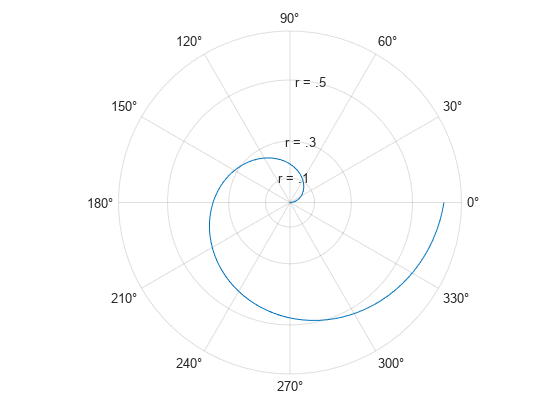
Specify r-Axis Tick Labels for Specific Polar Axes
Create a polar plot and assign the polar axes object to the variable pax. Ensure that rticks and rticklabels affect the polar axes you just created by specifying pax as the first input argument to the functions.
theta = 0:0.01:2*pi;
rho = 50*sin(2*theta);
polarplot(theta,rho)
pax = gca;

rticks(pax,[10 25 50])
rticklabels(pax,{'r = 10','r = 25','r = 50'})
Set r-Axis Tick Labels Back to Default Labels
Create a polar plot and specify the r-axis tick values and corresponding labels. Then, set the r-axis tick values and labels back to the default values.
theta = linspace(0,2*pi);
rho = theta/10;
polarplot(theta,rho)
rticks([0.1 0.25 0.5])
rticklabels({'r = .1','r = .3','r = .5'})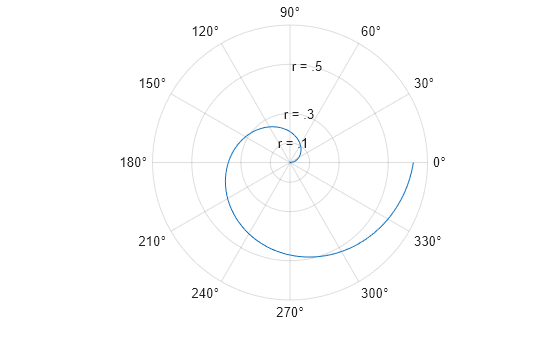
rticks('auto')
rticklabels('auto')

Remove r-Axis Tick Labels
Remove the tick labels along the r-axis by specifying the tick labels as an empty array.
theta = 0:0.01:2*pi;
rho = 50*sin(2*theta);
polarplot(theta,rho)
rticklabels({})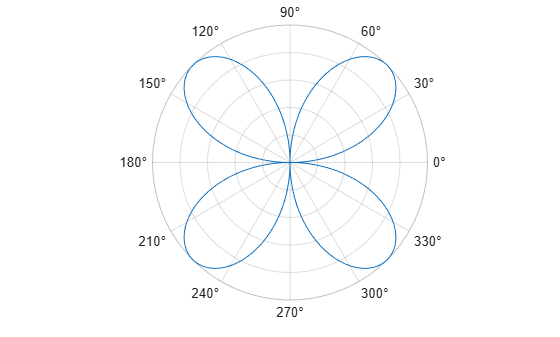
Input Arguments
Output Arguments
More About
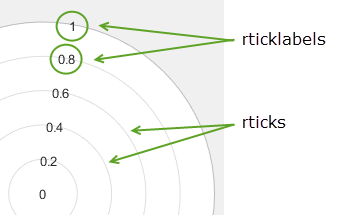
Tick Labels
The tick labels are the labels that you see
next to each tick mark. The tick values are the locations along the r-axis
where the tick marks appear. Set the tick values using the rticks function. Set the corresponding
tick labels using the rticklabels function.
Algorithms
The rticklabels function sets and queries
several polar axes properties related to the r-axis
tick labels.
RTickLabel— Property that stores the text for the r-axis tick labels.RTickLabelMode— Property that stores the r-axis tick label mode. When you set the r-axis tick labels usingrticklabels, this property changes to'manual'.RTickMode— Property that stores the r-axis tick value mode. When you set the r-axis tick labels usingrticklabels, this property changes to'manual'.
Version History
Introduced in R2016b
You can also select a web site from the following list:
Americas
- América Latina (Español)
- Canada (English)
- United States (English)
Europe
- Belgium (English)
- Denmark (English)
- Deutschland (Deutsch)
- España (Español)
- Finland (English)
- France (Français)
- Ireland (English)
- Italia (Italiano)
- Luxembourg (English)
- Netherlands (English)
- Norway (English)
- Österreich (Deutsch)
- Portugal (English)
- Sweden (English)
- Switzerland
- United Kingdom (English)