uislider
Create slider or range slider component
Syntax
Description
sld = uisliderSlider
object. MATLAB® calls the uifigure function to create the
figure.
sld = uislider(style)style as
"range" to create a range slider instead of a standard
one.
sld = uislider(___,Name,Value)Slider properties using one or more
name-value arguments in addition to any of the input argument combinations in
previous syntaxes. For example, uislider("Value",50) creates a
slider with a value of 50.
Examples
Create Slider
Create a slider component in a UI figure.
fig = uifigure;
sld = uislider(fig);

Create Range Slider
Create a range slider in a UI figure.
fig = uifigure;
sld = uislider(fig,"range");
Create Vertical Slider
Create a vertical slider in a UI figure.
fig = uifigure;
sld = uislider(fig,"Orientation","vertical");

Set and Access Slider Properties
Create a slider in a UI figure. Set the slider value to 50.
fig = uifigure;
sld = uislider(fig,"Value",50);
Determine the current slider limits.
limits = sld.Limits
limits = 1×2

     0   100
Change the slider limits and set the value to 35.
sld.Limits = [-50 50];
sld.Value = 35;

Configure Slider Tick Marks
Create a slider in a UI figure.
fig = uifigure;
sld = uislider(fig);

Customize the slider appearance. Update the limits and major ticks to correspond to temperatures in degrees Fahrenheit and remove the minor ticks.
sld.Limits = [32 212];
sld.MajorTicks = [32 100 150 212];
sld.MajorTickLabels = sld.MajorTicks + "°F";
sld.MinorTicks = [];
Code Response to Moved Slider Thumb
Create an app with a slider and a gauge. When an app user moves the slider thumb and releases the mouse button, the needle of the gauge updates to reflect the slider value.
In a file named sliderApp.m, write a function that implements the app:
Create a UI figure and a grid layout manager to lay out the app.
Create a gauge and a slider in the grid layout manager.
Write a callback function named
updateGaugethat changes the gauge value to match the slider value, and assign the function to theValueChangedFcncallback property of the slider. For more information about callbacks, see Create Callbacks for Apps Created Programmatically.
function sliderApp
fig = uifigure("Position",[100 100 300 250]);
g = uigridlayout(fig);
g.RowHeight = {'1x','fit'};
g.ColumnWidth = {'1x','fit','1x'};

cg = uigauge(g);
cg.Layout.Row = 1;
cg.Layout.Column = [1 3];

sld = uislider(g, ...
    "ValueChangedFcn",@(src,event)updateGauge(src,event,cg));
sld.Layout.Row = 2;
sld.Layout.Column = 2;
end

function updateGauge(src,event,cg)
cg.Value = event.Value;
end
Run the sliderApp function and move the slider thumb. When you release the thumb, the value of the gauge updates.
sliderApp

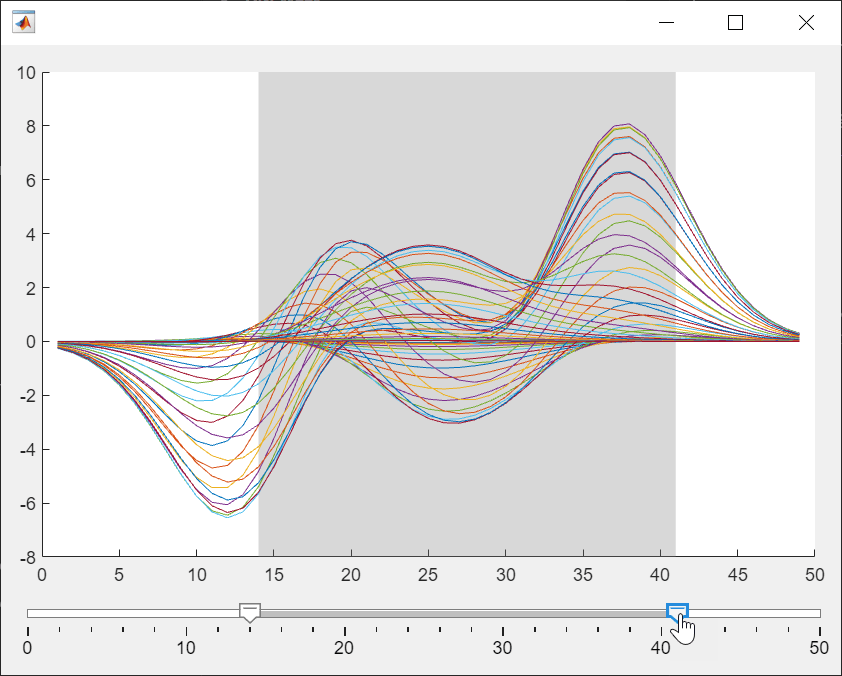
Code Response to Moving Slider Thumb
Create an app with a plot and a range slider. When an app user moves either of the slider thumbs, the shaded region of the plot updates to reflect the range slider value.
In a file named rangeSliderApp.m, write a function that implements the app:
Create a UI figure and a grid layout manager to lay out the app.
Create UI axes and a range slider in the grid layout manager. Plot some data in the UI axes and create a filled region to highlight a portion of the data.
Write a callback function named
updateRangethat updates the range of the filled region to match the range slider value, and assign the function to theValueChangingFcncallback property of the range slider. For more information about callbacks, see Create Callbacks for Apps Created Programmatically.
function rangeSliderApp
fig = uifigure;
g = uigridlayout(fig);
g.RowHeight = {'1x','fit'};
g.ColumnWidth = {'1x'};

ax = uiaxes(g);
plot(ax,peaks);
xr = xregion(ax,10,35);

sld = uislider(g,"range", ...
    "Limits",[0 50], ...
    "Value",[10 35]);

sld.ValueChangingFcn = @(src,event) updateRange(src,event,xr);
end

function updateRange(src,event,xr)
val = event.Value;
xr.Value = val;
end
Run the rangeSliderApp function and move the slider thumbs. The filled region in the axes updates as you drag either of the thumbs.
Input Arguments
Version History
Introduced in R2016aYou can also select a web site from the following list:
Americas
- América Latina (Español)
- Canada (English)
- United States (English)
Europe
- Belgium (English)
- Denmark (English)
- Deutschland (Deutsch)
- España (Español)
- Finland (English)
- France (Français)
- Ireland (English)
- Italia (Italiano)
- Luxembourg (English)
- Netherlands (English)
- Norway (English)
- Österreich (Deutsch)
- Portugal (English)
- Sweden (English)
- Switzerland
- United Kingdom (English)