anova2
Two-way analysis of variance
Syntax
Description
anova2 performs two-way analysis
of variance (ANOVA) with balanced designs. To perform two-way ANOVA
with unbalanced designs, see anovan.
p = anova2(y,reps)y.
reps is the number of replicates for each
combination of factor groups, which must be constant, indicating a
balanced design. For unbalanced designs, use anovan.
The anova2 function tests the main effects for
column and row factors and their interaction effect. To test the interaction
effect, reps must be greater than 1.
anova2 also displays the standard ANOVA
table.
p = anova2(y,reps,displayopt)displayopt is 'on' (default)
and suppresses the display when displayopt is 'off'.
[ returns a p,tbl,stats]
= anova2(___)stats structure,
which you can use to perform a multiple comparison test. A multiple
comparison test enables you to determine which pairs of group means
are significantly different. To perform this test, use multcompare, providing the stats structure
as input.
Examples
Load the sample data.
load popcorn
popcorn
popcorn = 6×3
5.5000 4.5000 3.5000
5.5000 4.5000 4.0000
6.0000 4.0000 3.0000
6.5000 5.0000 4.0000
7.0000 5.5000 5.0000
7.0000 5.0000 4.5000
The data is from a study of popcorn brands and popper types (Hogg 1987). The columns of the matrix popcorn are brands, Gourmet, National, and Generic, respectively. The rows are popper types, oil and air. In the study, researchers popped a batch of each brand three times with each popper, that is, the number of replications is 3. The first three rows correspond to the oil popper, and the last three rows correspond to the air popper. The response values are the yield in cups of popped popcorn.
Perform a two-way ANOVA. Save the ANOVA table in the cell array tbl for easy access to results.
[p,tbl] = anova2(popcorn,3);
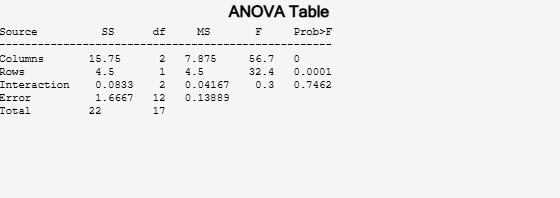
The column Prob>F shows the p-values for the three brands of popcorn (0.0000), the two popper types (0.0001), and the interaction between brand and popper type (0.7462). These values indicate that popcorn brand and popper type affect the yield of popcorn, but there is no evidence of an interaction effect of the two.
Display the cell array containing the ANOVA table.
tbl
tbl=6×6 cell array
    {'Source'     }    {'SS'     }    {'df'}    {'MS'      }    {'F'       }    {'Prob>F'    }
    {'Columns'    }    {[15.7500]}    {[ 2]}    {[  7.8750]}    {[ 56.7000]}    {[7.6790e-07]}
    {'Rows'       }    {[ 4.5000]}    {[ 1]}    {[  4.5000]}    {[ 32.4000]}    {[1.0037e-04]}
    {'Interaction'}    {[ 0.0833]}    {[ 2]}    {[  0.0417]}    {[  0.3000]}    {[    0.7462]}
    {'Error'      }    {[ 1.6667]}    {[12]}    {[  0.1389]}    {0×0 double}    {0×0 double  }
    {'Total'      }    {[     22]}    {[17]}    {0×0 double}    {0×0 double}    {0×0 double  }
Store the F-statistic for the factors and factor interaction in separate variables.
Fbrands = tbl{2,5}Fbrands = 56.7000
Fpoppertype = tbl{3,5}Fpoppertype = 32.4000
Finteraction = tbl{4,5}Finteraction = 0.3000
Load the sample data.
load popcorn
popcorn
popcorn = 6×3
5.5000 4.5000 3.5000
5.5000 4.5000 4.0000
6.0000 4.0000 3.0000
6.5000 5.0000 4.0000
7.0000 5.5000 5.0000
7.0000 5.0000 4.5000
The data is from a study of popcorn brands and popper types (Hogg 1987). The columns of the matrix popcorn are brands (Gourmet, National, and Generic). The rows are popper types oil and air. The first three rows correspond to the oil popper, and the last three rows correspond to the air popper. In the study, researchers popped a batch of each brand three times with each popper. The values are the yield in cups of popped popcorn.
Perform a two-way ANOVA. Also compute the statistics that you need to perform a multiple comparison test on the main effects.
[~,~,stats] = anova2(popcorn,3,"off")stats = struct with fields:
source: 'anova2'
sigmasq: 0.1389
colmeans: [6.2500 4.7500 4]
coln: 6
rowmeans: [4.5000 5.5000]
rown: 9
inter: 1
pval: 0.7462
df: 12
The stats structure includes
The mean squared error (
sigmasq)The estimates of the mean yield for each popcorn brand (
colmeans)The number of observations for each popcorn brand (
coln)The estimate of the mean yield for each popper type (
rowmeans)The number of observations for each popper type (
rown)The number of interactions (
inter)The p-value that shows the significance level of the interaction term (
pval)The error degrees of freedom (
df).
Perform a multiple comparison test to see if the popcorn yield differs between pairs of popcorn brands (columns).
c1 = multcompare(stats);
Note: Your model includes an interaction term.  A test of main effects can be
difficult to interpret when the model includes interactions.
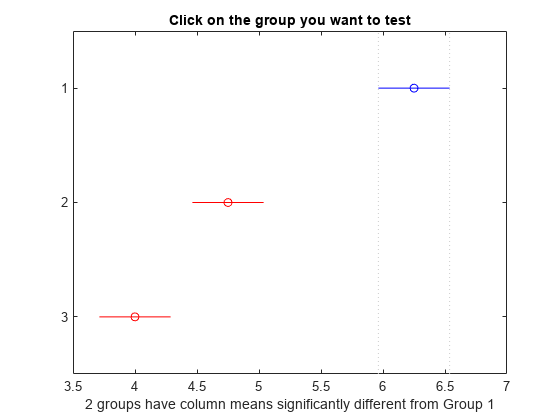
The figure shows the multiple comparisons of the means. By default, the group 1 mean is highlighted and the comparison interval is in blue. Because the comparison intervals for the other two groups do not intersect with the intervals for the group 1 mean, they are highlighted in red. This lack of intersection indicates that both means are different than group 1 mean. Select other group means to confirm that all group means are significantly different from each other.
Display the multiple comparison results in a table.
tbl1 = array2table(c1,"VariableNames", ...
    ["Group A","Group B","Lower Limit","A-B","Upper Limit","P-value"])
tbl1=3×6 table
    Group A    Group B    Lower Limit    A-B     Upper Limit     P-value
    _______    _______    ___________    ____    ___________    __________

       1          2         0.92597       1.5       2.074       4.1188e-05
       1          3           1.676      2.25       2.824       6.1588e-07
       2          3         0.17597      0.75       1.324         0.011591
The first two columns of c1 show the groups that are compared. The fourth column shows the difference between the estimated group means. The third and fifth columns show the lower and upper limits for 95% confidence intervals for the true mean difference. The sixth column contains the p-value for a hypothesis test that the corresponding mean difference is equal to zero. All p-values are very small, which indicates that the popcorn yield differs across all three brands.
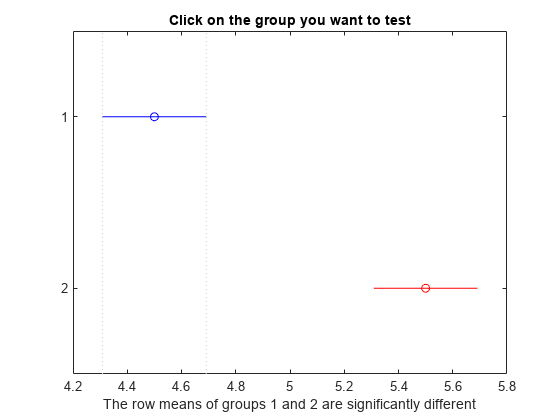
Perform a multiple comparison test to see the popcorn yield differs between the two popper types (rows).
c2 = multcompare(stats,"Estimate","row");
Note: Your model includes an interaction term.  A test of main effects can be
difficult to interpret when the model includes interactions.
tbl2 = array2table(c2,"VariableNames", ...
    ["Group A","Group B","Lower Limit","A-B","Upper Limit","P-value"])
tbl2=1×6 table
    Group A    Group B    Lower Limit    A-B    Upper Limit     P-value
    _______    _______    ___________    ___    ___________    __________

       1          2         -1.3828      -1      -0.61722      0.00010037
The small p-value indicates that the popcorn yield differs between the two popper types (air and oil). The figure shows the same results. The disjoint comparison intervals indicate that the group means are significantly different from each other.
Input Arguments
Output Arguments
Alternative Functionality
Instead of using anova2, you can create an anova
object by using the anova function.
The anova function provides these advantages:
The
anovafunction allows you to specify the ANOVA model type, sum of squares type, and factors to treat as categorical.anovaalso supports table predictor and response input arguments.In addition to the outputs returned by
anova2, the properties of theanovaobject contain the following:ANOVA model formula
Fitted ANOVA model coefficients
Residuals
Factors and response data
The
anovaobject functions allow you to conduct further analysis after fitting theanovaobject. For example, you can create an interactive plot of multiple comparisons of means for the ANOVA, get the mean response estimates for each value of a factor, and calculate the variance component estimates.
References
[1] Hogg, R. V., and J. Ledolter. Engineering Statistics. New York: MacMillan, 1987.
Version History
Introduced before R2006a
See Also
anova | anova1 | anovan | multcompare