Nonparametric and Empirical Probability Distributions
Overview
In some situations, you cannot accurately describe a data sample using a parametric distribution. Instead, the probability density function (pdf) or cumulative distribution function (cdf) must be estimated from the data. Statistics and Machine Learning Toolbox™ provides several options for estimating the pdf or cdf from sample data.
Kernel Distribution
A kernel distribution produces a nonparametric probability density estimate that adapts itself to the data, rather than selecting a density with a particular parametric form and estimating the parameters. This distribution is defined by a kernel density estimator, a smoothing function that determines the shape of the curve used to generate the pdf, and a bandwidth value that controls the smoothness of the resulting density curve.
Similar to a histogram, the kernel distribution builds a function to represent the probability distribution using the sample data. But unlike a histogram, which places the values into discrete bins, a kernel distribution sums the component smoothing functions for each data value to produce a smooth, continuous probability curve. The following plot shows a visual comparison of a histogram and a kernel distribution generated from the same sample data.
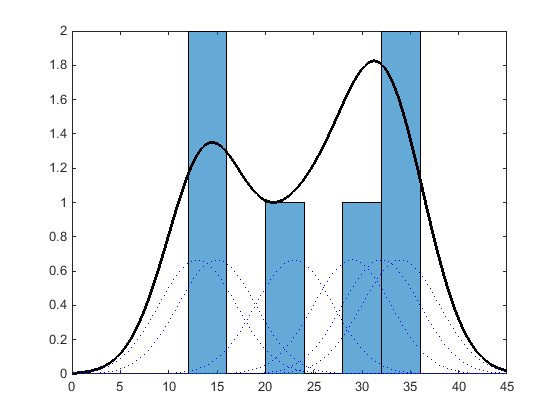
A histogram represents the probability distribution by establishing bins and placing each data value in the appropriate bin. Because of this bin count approach, the histogram produces a discrete probability density function. This might be unsuitable for certain applications, such as generating random numbers from a fitted distribution.
Alternatively, the kernel distribution builds the probability density function (pdf) by creating an individual probability density curve for each data value, then summing the smooth curves. This approach creates one smooth, continuous probability density function for the data set.
For more general information about kernel distributions, see Kernel Distribution. For information on how to work with a kernel
distribution, see KernelDistribution and ksdensity.
Empirical Distribution
An empirical distribution estimates the probability density function (pdf) and cumulative
density function (cdf) values from the given observations only. The pdf for a random
variable is the ratio of the frequency of the variable to the total number of
observations in the sample. You estimate the empirical cdf (ecdf) of a random variable by assigning equal probability to each
observation in a sample. The cdf is the proportion of observations less than or
equal to the random variable. Therefore, the ecdf is a discrete cumulative
distribution function that creates an exact match between the ecdf and the
distribution of the sample data.
The following plot shows a visual comparison of the ecdf of 20 random numbers generated from a standard normal distribution, and the theoretical cdf of a standard normal distribution. The circles indicate the value of the ecdf calculated at each sample data point. The dashed line that passes through each circle visually represents the ecdf, although the ecdf is not a continuous function. The solid line shows the theoretical cdf of the standard normal distribution from which the random numbers in the sample data were drawn.

The ecdf is similar in shape to the theoretical cdf, although it is not an exact match.
Instead, the ecdf is an exact match to the sample data. The ecdf is a discrete
function, and is not smooth, especially in the tails where data might be sparse. You
can smooth the distribution with Pareto tails, using the
paretotails function.
For more information and additional syntax options, see ecdf. For information on how to work with an empirical distribution,
see EmpiricalDistribution.
Piecewise Linear Distribution
A piecewise linear distribution estimates an overall cdf for the sample data by computing the cdf value at each individual point, and then linearly connecting these values to form a continuous curve.
The following plot shows the cdf for a piecewise linear distribution based on a sample of hospital patients’ weight measurements. The circles represent each individual data point (weight measurement). The black line that passes through each data point represents the piecewise linear distribution cdf for the sample data.

A piecewise linear distribution linearly connects the cdf values
calculated at each sample data point to form a continuous curve. By
contrast, an empirical cumulative
distribution function constructed using the ecdf function produces a discrete cdf.
For example, random numbers generated from the ecdf can only include x values
contained in the original sample data. Random numbers generated from
a piecewise linear distribution can include any x value
between the lower and upper boundaries of the sample data.
Because the piecewise linear distribution cdf is constructed from the values contained in the
sample data, the resulting curve is often not smooth, especially in the tails where
data might be sparse. You can smooth the distribution with Pareto tails, using the
paretotails function.
For information on how to work with a piecewise linear distribution, see PiecewiseLinearDistribution.
Pareto Tails
Pareto tails use a piecewise approach to improve the fit of a nonparametric cdf by smoothing the tails of the distribution. You can fit a kernel distribution, empirical cdf, or a user-defined estimator to the middle data values, then fit generalized Pareto distribution curves to the tails. This technique is especially useful when the sample data is sparse in the tails.
The following plot shows the empirical cdf (ecdf) of a data sample containing 20 random numbers. The solid line represents the ecdf, and the dashed line represents the empirical cdf with Pareto tails fit to the lower and upper 10 percent of the data. The circles denote the boundaries for the lower and upper 10 percent of the data.

Fitting Pareto tails to the lower and upper 10 percent of the sample data makes the cdf
smoother in the tails, where the data is sparse. For more information on working
with Pareto tails, see paretotails.
Triangular Distribution
A Triangular Distribution provides a simplistic representation of the probability distribution when limited sample data is available. This continuous distribution is parameterized by a lower limit, peak location, and upper limit. These points are linearly connected to estimate the pdf of the sample data. You can use the mean, median, or mode of the data as the peak location.
The following plot shows the triangular distribution pdf of a random sample of 10 integers from 0 to 5. The lower limit is the smallest integer in the sample data, and the upper limit is the largest integer. The peak for this plot is at the mode, or most frequently-occurring value, in the sample data.

Business applications such as simulation and project management sometimes use a triangular distribution to create models when limited sample data exists. For more information, see Triangular Distribution.
See Also
ecdf | ksdensity | paretotails