perfcurve
Receiver operating characteristic (ROC) curve or other performance curve for classifier output
Syntax
Description
[___] = perfcurve( returns
the coordinates of a ROC curve and any other output argument from
the previous syntaxes, with additional options specified by one or
more labels,scores,posclass,Name,Value)Name,Value pair arguments.
For example, you can provide a list of negative classes, change
the X or Y criterion, compute pointwise confidence
bounds using cross validation or bootstrap, specify the misclassification
cost, or compute the confidence bounds in parallel.
Examples
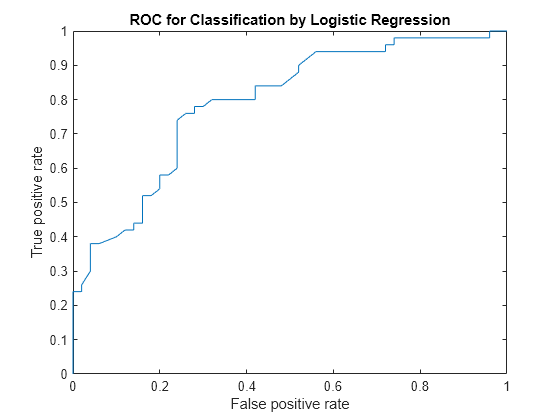
Load the sample data.
load fisheririsUse only the first two features as predictor variables. Define a binary classification problem by using only the measurements that correspond to the species versicolor and virginica.
pred = meas(51:end,1:2);
Define the binary response variable.
resp = (1:100)'>50; % Versicolor = 0, virginica = 1Fit a logistic regression model.
mdl = fitglm(pred,resp,'Distribution','binomial','Link','logit');
Compute the ROC curve. Use the probability estimates from the logistic regression model as scores.
scores = mdl.Fitted.Probability;
[X,Y,T,AUC] = perfcurve(species(51:end,:),scores,'virginica');
perfcurve stores the threshold values in the array T.
Display the area under the curve.
AUC
AUC =
0.7918
The area under the curve is 0.7918. The maximum AUC is 1, which corresponds to a perfect classifier. Larger AUC values indicate better classifier performance.
Plot the ROC curve.
plot(X,Y)
xlabel('False positive rate')
ylabel('True positive rate')
title('ROC for Classification by Logistic Regression')
Alternatively, you can compute and plot the ROC curve by creating a rocmetrics object and using the object function plot.
rocObj = rocmetrics(species(51:end,:),scores,'virginica');
plot(rocObj)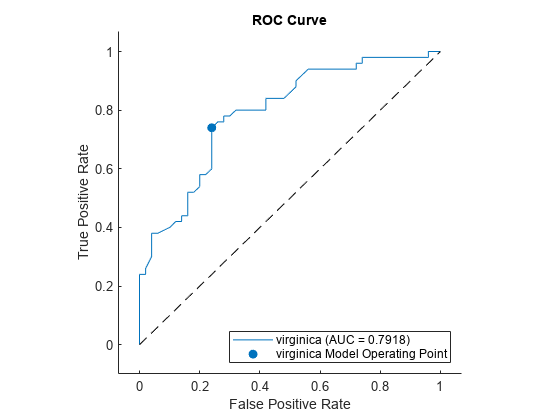
The plot function displays a filled circle at the model operating point, and the legend displays the class name and AUC value for the curve.
Load the sample data.
load ionosphereX is a 351x34 real-valued matrix of predictors. Y is a character array of class labels: 'b' for bad radar returns and 'g' for good radar returns.
Reformat the response to fit a logistic regression. Use the predictor variables 3 through 34.
resp = strcmp(Y,'b'); % resp = 1, if Y = 'b', or 0 if Y = 'g'
pred = X(:,3:34);
Fit a logistic regression model to estimate the posterior probabilities for a radar return to be a bad one.
mdl = fitglm(pred,resp,'Distribution','binomial','Link','logit');
score_log = mdl.Fitted.Probability; % Probability estimates
Compute the standard ROC curve using the probabilities for scores.
[Xlog,Ylog,Tlog,AUClog] = perfcurve(resp,score_log,'true');Train an SVM classifier on the same sample data. Standardize the data.
mdlSVM = fitcsvm(pred,resp,'Standardize',true);Compute the posterior probabilities (scores).
mdlSVM = fitPosterior(mdlSVM);
[~,score_svm] = resubPredict(mdlSVM);
The second column of score_svm contains the posterior probabilities of bad radar returns.
Compute the standard ROC curve using the scores from the SVM model.
[Xsvm,Ysvm,Tsvm,AUCsvm] = perfcurve(resp,score_svm(:,mdlSVM.ClassNames),'true');Fit a naive Bayes classifier on the same sample data.
mdlNB = fitcnb(pred,resp);
Compute the posterior probabilities (scores).
[~,score_nb] = resubPredict(mdlNB);
Compute the standard ROC curve using the scores from the naive Bayes classification.
[Xnb,Ynb,Tnb,AUCnb] = perfcurve(resp,score_nb(:,mdlNB.ClassNames),'true');Plot the ROC curves on the same graph.
plot(Xlog,Ylog)
hold on
plot(Xsvm,Ysvm)
plot(Xnb,Ynb)
legend('Logistic Regression','Support Vector Machines','Naive Bayes','Location','Best')
xlabel('False positive rate'); ylabel('True positive rate');
title('ROC Curves for Logistic Regression, SVM, and Naive Bayes Classification')
hold off
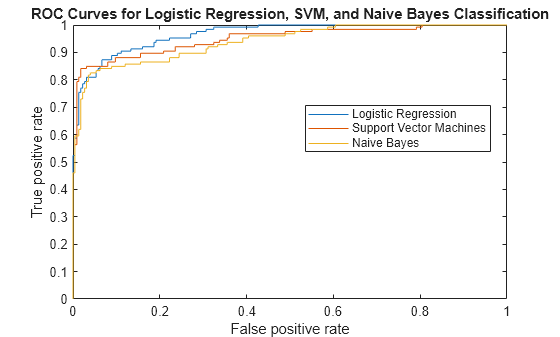
Although SVM produces better ROC values for higher thresholds, logistic regression is usually better at distinguishing the bad radar returns from the good ones. The ROC curve for naive Bayes is generally lower than the other two ROC curves, which indicates worse in-sample performance than the other two classifier methods.
Compare the area under the curve for all three classifiers.
AUClog
AUClog =
0.9659
AUCsvm
AUCsvm =
0.9489
AUCnb
AUCnb =
0.9393
Logistic regression has the highest AUC measure for classification and naive Bayes has the lowest. This result suggests that logistic regression has better in-sample average performance for this sample data.
This example shows how to determine the better parameter value for a custom kernel function in a classifier using the ROC curves.
Generate a random set of points within the unit circle.
rng(1);  % For reproducibility
n = 100; % Number of points per quadrant

r1 = sqrt(rand(2*n,1));                     % Random radii
t1 = [pi/2*rand(n,1); (pi/2*rand(n,1)+pi)]; % Random angles for Q1 and Q3
X1 = [r1.*cos(t1) r1.*sin(t1)];             % Polar-to-Cartesian conversion

r2 = sqrt(rand(2*n,1));
t2 = [pi/2*rand(n,1)+pi/2; (pi/2*rand(n,1)-pi/2)]; % Random angles for Q2 and Q4
X2 = [r2.*cos(t2) r2.*sin(t2)];
Define the predictor variables. Label points in the first and third quadrants as belonging to the positive class, and those in the second and fourth quadrants in the negative class.
pred = [X1; X2];
resp = ones(4*n,1);
resp(2*n + 1:end) = -1; % Labels
Create the function mysigmoid.m , which accepts two matrices in the feature space as inputs, and transforms them into a Gram matrix using the sigmoid kernel.
function G = mysigmoid(U,V)
% Sigmoid kernel function with slope gamma and intercept c
gamma = 1;
c = -1;
G = tanh(gamma*U*V' + c);
end
Train an SVM classifier using the sigmoid kernel function. It is good practice to standardize the data.
SVMModel1 = fitcsvm(pred,resp,'KernelFunction','mysigmoid',...
				'Standardize',true);
SVMModel1 = fitPosterior(SVMModel1);
[~,scores1] = resubPredict(SVMModel1);
Set gamma = 0.5 ; within mysigmoid.m and save as mysigmoid2.m. And, train an SVM classifier using the adjusted sigmoid kernel.
function G = mysigmoid2(U,V)
% Sigmoid kernel function with slope gamma and intercept c
gamma = 0.5;
c = -1;
G = tanh(gamma*U*V' + c);
end
SVMModel2 = fitcsvm(pred,resp,'KernelFunction','mysigmoid2',...
				'Standardize',true);
SVMModel2 = fitPosterior(SVMModel2);
[~,scores2] = resubPredict(SVMModel2);
Compute the ROC curves and the area under the curve (AUC) for both models.
[x1,y1,~,auc1] = perfcurve(resp,scores1(:,2),1);
[x2,y2,~,auc2] = perfcurve(resp,scores2(:,2),1);
Plot the ROC curves.
plot(x1,y1)
hold on
plot(x2,y2)
hold off
legend('gamma = 1','gamma = 0.5','Location','SE');
xlabel('False positive rate'); ylabel('True positive rate');
title('ROC for classification by SVM');
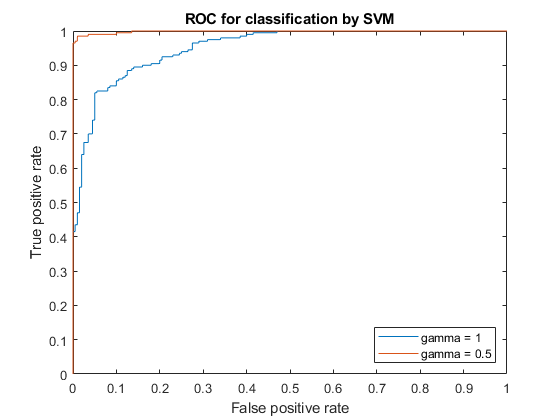
The kernel function with the gamma parameter set to 0.5 gives better in-sample results.
Compare the AUC measures.
auc1
auc2
auc1 =

    0.9518


auc2 =

    0.9985

The area under the curve for gamma set to 0.5 is higher than that for gamma set to 1. This also confirms that gamma parameter value of 0.5 produces better results. For visual comparison of the classification performance with these two gamma parameter values, see Train SVM Classifier Using Custom Kernel.
Load the sample data.
load fisheririsThe column vector, species, consists of iris flowers of three different species: setosa, versicolor, virginica. The double matrix meas consists of four types of measurements on the flowers: sepal length, sepal width, petal length, and petal width. All measures are in centimeters.
Train a classification tree using the sepal length and width as the predictor variables. It is a good practice to specify the class names.
Model = fitctree(meas(:,1:2),species, ...
    'ClassNames',{'setosa','versicolor','virginica'});
Predict the class labels and scores for the species based on the tree Model.
[~,score] = resubPredict(Model);
The scores are the posterior probabilities that an observation (a row in the data matrix) belongs to a class. The columns of score correspond to the classes specified by 'ClassNames'. So, the first column corresponds to setosa, the second corresponds to versicolor, and the third column corresponds to virginica.
Compute the ROC curve for the predictions that an observation belongs to versicolor, given the true class labels species. Also compute the optimal operating point and y values for negative subclasses. Return the names of the negative classes.
Because this is a multiclass problem, you cannot merely supply score(:,2) as input to perfcurve. Doing so would not give perfcurve enough information about the scores for the two negative classes (setosa and virginica). This problem is unlike a binary classification problem, where knowing the scores of one class is enough to determine the scores of the other class. Therefore, you must supply perfcurve with a function that factors in the scores of the two negative classes. One such function is , which corresponds to the one-versus-all coding design.
diffscore1 = score(:,2) - max(score(:,1),score(:,3));
The values in diffscore are classification scores for a binary problem that treats the second class as a positive class and the rest as negative classes.
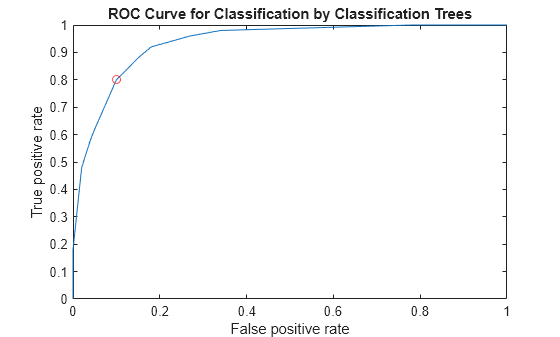
[X,Y,T,~,OPTROCPT,suby,subnames] = perfcurve(species,diffscore1,'versicolor');X, by default, is the false positive rate (fallout or 1-specificity) and Y, by default, is the true positive rate (recall or sensitivity). The positive class label is versicolor. Because a negative class is not defined, perfcurve assumes that the observations that do not belong to the positive class are in one class. The function accepts it as the negative class.
OPTROCPT
OPTROCPT = 1×2

    0.1000    0.8000
suby
suby = 12×2

         0         0
    0.1800    0.1800
    0.4800    0.4800
    0.5800    0.5800
    0.6200    0.6200
    0.8000    0.8000
    0.8800    0.8800
    0.9200    0.9200
    0.9600    0.9600
    0.9800    0.9800
    1.0000    1.0000
    1.0000    1.0000
subnames
subnames = 1×2 cell
    {'setosa'}    {'virginica'}
Plot the ROC curve and the optimal operating point on the ROC curve.
plot(X,Y)
hold on
plot(OPTROCPT(1),OPTROCPT(2),'ro')
xlabel('False positive rate')
ylabel('True positive rate')
title('ROC Curve for Classification by Classification Trees')
hold off
Find the threshold that corresponds to the optimal operating point.
T((X==OPTROCPT(1))&(Y==OPTROCPT(2)))
ans =
0.2857
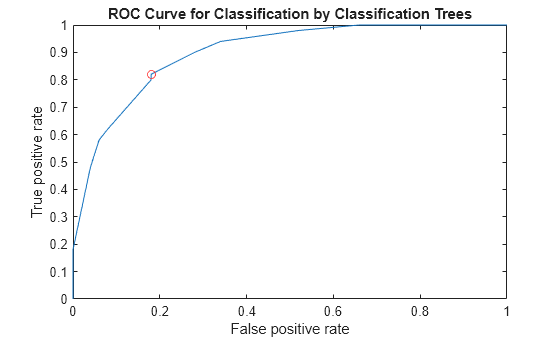
Specify virginica as the negative class and compute and plot the ROC curve for versicolor.
Again, you must supply perfcurve with a function that factors in the scores of the negative class. An example of a function to use is .
diffscore2 = score(:,2) - score(:,3);
[X,Y,~,~,OPTROCPT] = perfcurve(species,diffscore2,'versicolor', ...
    'negClass','virginica');
OPTROCPT
OPTROCPT = 1×2

    0.1800    0.8200
figure, plot(X,Y)
hold on
plot(OPTROCPT(1),OPTROCPT(2),'ro')
xlabel('False positive rate')
ylabel('True positive rate')
title('ROC Curve for Classification by Classification Trees')
hold off
Alternatively, you can use a rocmetrics object to create the ROC curve. rocmetrics supports multiclass classification problems using the one-versus-all coding design, which reduces a multiclass problem into a set of binary problems. You can examine the performance of a multiclass problem on each class by plotting a one-versus-all ROC curve for each class.
Compute the performance metrics by creating a rocmetrics object. Specify the true labels, classification scores, and class names.
rocObj = rocmetrics(species,score,Model.ClassNames);
Plot the ROC curve for each class by using the plot function of rocmetrics.
figure
plot(rocObj)
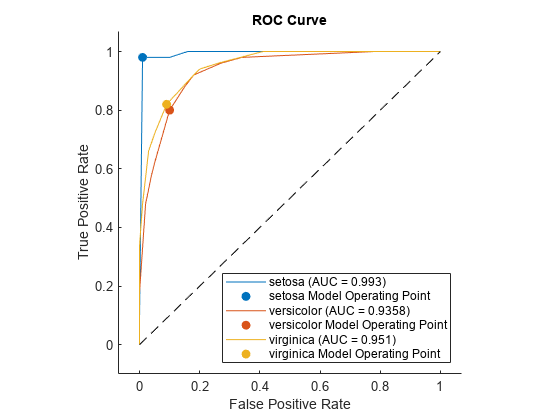
The plot function displays a filled circle at the model operating point for each class, and the legend shows the class name and AUC value for each curve. You can find the optimal operating points by using the properties stored in the rocmetrics object rocObj. For an example, see Find Model Operating Point and Optimal Operating Point.
Load the sample data.
load fisheririsThe column vector species consists of iris flowers of three different species: setosa, versicolor, virginica. The double matrix meas consists of four types of measurements on the flowers: sepal length, sepal width, petal length, and petal width. All measures are in centimeters.
Use only the first two features as predictor variables. Define a binary problem by using only the measurements that correspond to the versicolor and virginica species.
pred = meas(51:end,1:2);
Define the binary response variable.
resp = (1:100)'>50; % Versicolor = 0, virginica = 1Fit a logistic regression model.
mdl = fitglm(pred,resp,'Distribution','binomial','Link','logit');
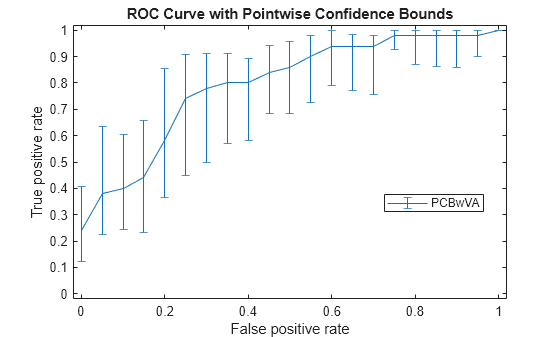
Compute the pointwise confidence intervals on the true positive rate (TPR) by vertical averaging (VA) and sampling using bootstrap.
[X,Y,T] = perfcurve(species(51:end,:),mdl.Fitted.Probability,...
       'virginica','NBoot',1000,'XVals',[0:0.05:1]);
'NBoot',1000 sets the number of bootstrap replicas to 1000. 'XVals','All' prompts perfcurve to return X, Y, and T values for all scores, and average the Y values (true positive rate) at all X values (false positive rate) using vertical averaging. If you do not specify XVals, then perfcurve computes the confidence bounds using threshold averaging by default.
Plot the pointwise confidence intervals.
errorbar(X,Y(:,1),Y(:,1)-Y(:,2),Y(:,3)-Y(:,1));
xlim([-0.02,1.02]); ylim([-0.02,1.02]);
xlabel('False positive rate')
ylabel('True positive rate')
title('ROC Curve with Pointwise Confidence Bounds')
legend('PCBwVA','Location','Best')
It might not always be possible to control the false positive rate (FPR, the X value in this example). So you might want to compute the pointwise confidence intervals on true positive rates (TPR) by threshold averaging.
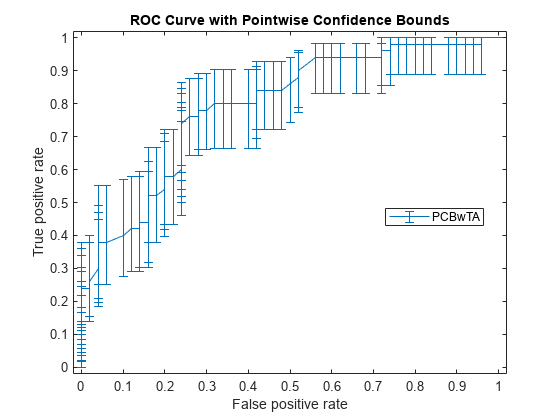
[X1,Y1,T1] = perfcurve(species(51:end,:),mdl.Fitted.Probability,...
    'virginica','NBoot',1000);
If you set 'TVals' to 'All', or if you do not specify 'TVals' or 'Xvals', then perfcurve returns X, Y, and T values for all scores and computes pointwise confidence bounds for X and Y using threshold averaging.
Plot the confidence bounds.
figure()
errorbar(X1(:,1),Y1(:,1),Y1(:,1)-Y1(:,2),Y1(:,3)-Y1(:,1));
xlim([-0.02,1.02]); ylim([-0.02,1.02]);
xlabel('False positive rate')
ylabel('True positive rate')
title('ROC Curve with Pointwise Confidence Bounds')
legend('PCBwTA','Location','Best')
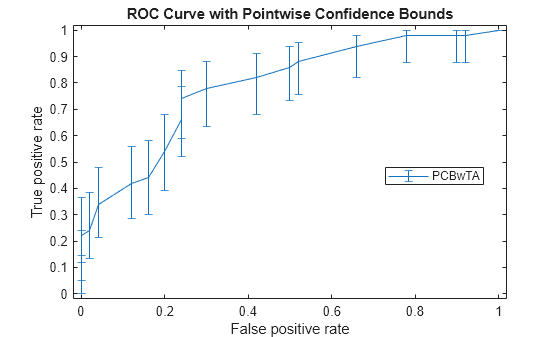
Specify the threshold values to fix and compute the ROC curve. Then plot the curve.
[X1,Y1,T1] = perfcurve(species(51:end,:),mdl.Fitted.Probability,...
    'virginica','NBoot',1000,'TVals',0:0.05:1);
figure()
errorbar(X1(:,1),Y1(:,1),Y1(:,1)-Y1(:,2),Y1(:,3)-Y1(:,1));
xlim([-0.02,1.02]); ylim([-0.02,1.02]);
xlabel('False positive rate')
ylabel('True positive rate')
title('ROC Curve with Pointwise Confidence Bounds')
legend('PCBwTA','Location','Best')
Input Arguments
Name-Value Arguments
Output Arguments
Algorithms
Alternative Functionality
You can compute the performance metrics for a ROC curve and other performance curves by creating a
rocmetricsobject.rocmetricssupports both binary and multiclass classification problems. You can pass classification scores returned by thepredictfunction of a classification model object (such aspredictofClassificationTree) torocmetricswithout adjusting scores for a multiclass model.rocmetricsprovides object functions to plot a ROC curve (plot), find an average ROC curve for multiclass problems (average), and compute additional metrics after creating an object (addMetrics). For more details, see the reference pages and ROC Curve and Performance Metrics.