plot
Plot timeseries
Description
plot(
plots the ts,LineSpec)timeseries data using a line graph and applies the
specified specs to lines, markers, or both.
You can also specify name-value arguments to define Line Properties.
p = plot(___) returns a Line
object or an array of Line objects. Use p to
modify properties of the plot after creating it. For a list of properties, see
Line Properties.
Examples
Create a time series object, set the start date, and then plot the time vector relative to the start date.
x = [2 5 8 2 11 3 6];
ts1 = timeseries(x,1:7);

ts1.Name = 'Daily Count';
ts1.TimeInfo.Units = 'days';
ts1.TimeInfo.StartDate = '01-Jan-2011';     % Set start date.
ts1.TimeInfo.Format = 'mmm dd, yy';       % Set format for display on x-axis.

ts1.Time = ts1.Time - ts1.Time(1);        % Express time relative to the start date.

plot(ts1)

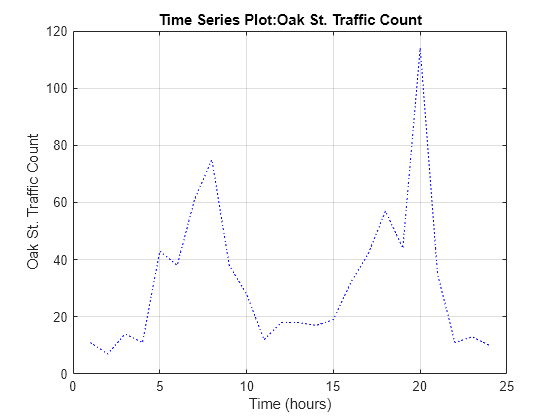
Create two time series objects from traffic count data, and then plot them in sequence on the same axes. Add an event to one series, which is automatically displayed with a red marker.
load count.dat;
count1 = timeseries(count(:,1),1:24);
count1.Name = 'Oak St. Traffic Count';
count1.TimeInfo.Units = 'hours';
plot(count1,':b')
grid on
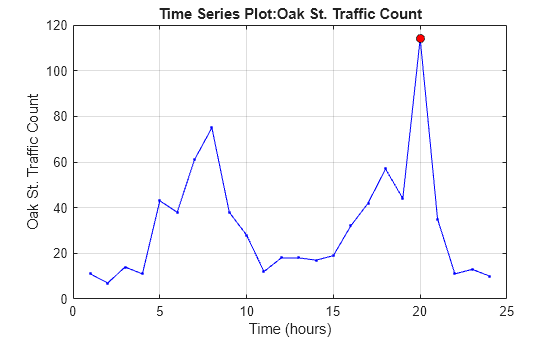
Obtain time of maximum value and add it as an event:
[~,index] = max(count1.Data);
max_event = tsdata.event('peak',count1.Time(index));
max_event.Units = 'hours';
Add the event to the time series:
count1 = addevent(count1,max_event);
Replace plot with new one showing the event:
plot(count1,'.-b')
grid on
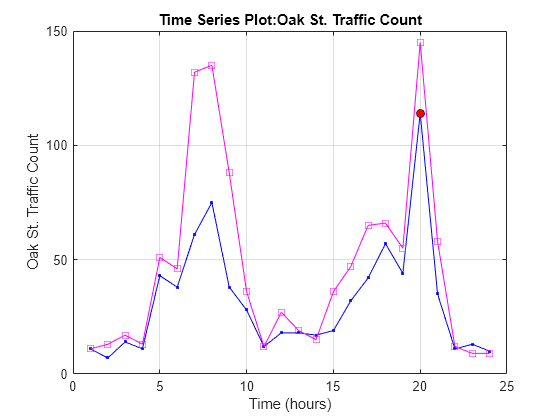
Make a new time series object from column 2 of the same data source:
count2 = timeseries(count(:,2),1:24);
count2.Name = 'Maple St. Traffic Count';
count2.TimeInfo.Units = 'hours';
Turn hold on to add the new data to the plot:
hold onThe plot method does not add labels to a held plot. Use property/value pairs to customize markers:
plot(count2,'s-m','MarkerSize',6),
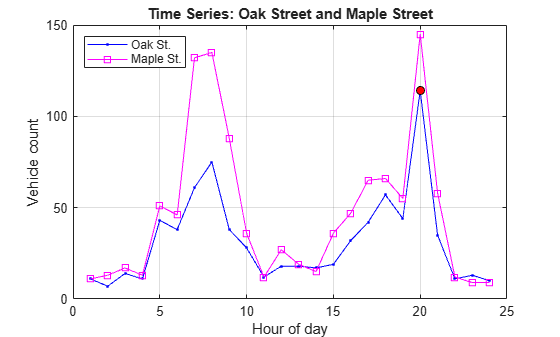
Labels are erased, so generate them manually:
title('Time Series: Oak Street and Maple Street')
xlabel('Hour of day')
ylabel('Vehicle count')
Add a legend in the upper left:
legend('Oak St.','Maple St.','Location','northwest')
Input Arguments
Input timeseries, specified as a scalar.
Line style, marker, and color, specified as a string scalar or character vector containing symbols. The symbols can appear in any order. You do not need to specify all three characteristics (line style, marker, and color). For example, if you omit the line style and specify the marker, then the plot shows only the marker and no line.
Example: "--or" is a red dashed line with circle markers.
| Line Style | Description | Resulting Line |
|---|---|---|
"-" | Solid line |
|
"--" | Dashed line |
|
":" | Dotted line |
|
"-." | Dash-dotted line |
|
| Marker | Description | Resulting Marker |
|---|---|---|
"o" | Circle |
|
"+" | Plus sign |
|
"*" | Asterisk |
|
"." | Point |
|
"x" | Cross |
|
"_" | Horizontal line |
|
"|" | Vertical line |
|
"square" | Square |
|
"diamond" | Diamond |
|
"^" | Upward-pointing triangle |
|
"v" | Downward-pointing triangle |
|
">" | Right-pointing triangle |
|
"<" | Left-pointing triangle |
|
"pentagram" | Pentagram |
|
"hexagram" | Hexagram |
|
| Color Name | Short Name | RGB Triplet | Appearance |
|---|---|---|---|
"red" | "r" | [1 0 0] |
|
"green" | "g" | [0 1 0] |
|
"blue" | "b" | [0 0 1] |
|
"cyan"
| "c" | [0 1 1] |
|
"magenta" | "m" | [1 0 1] |
|
"yellow" | "y" | [1 1 0] |
|
"black" | "k" | [0 0 0] |
|
"white" | "w" | [1 1 1] |
|
Tips
The
plotfunction generates titles and axis labels automatically. These labels are:Plot Title —
'Time Series Plot:
                                    <name>'
where
<name>is the string assigned tots.Name, or by default,'unnamed'X-Axis Label —
'Time
                                (<units>)'
where
<units>is the value of thets.TimeInfo.Unitsfield, which defaults to'seconds'Y-Axis Label —
'<name>'where
<name>is the string assigned tots.Name, or by default,'unnamed'
You can place new time series data on a time series plot (by setting
hold on, for example, and issuing anothertimeseries/plotcommand). When you add data to a plot, the title and axis labels become blank strings to avoid labeling confusion. You can add your own labels after plotting using thetitle,xlabel, andylabelcommands.Time series events, when defined, are marked in the plot with a circular marker with red fill. You can also specify markers for all data points using a
linespecor name/value syntax in addition to any event markers your data defines. The event markers plot on top of the markers you define.The value assigned to
ts.DataInfo.Interpolation.Namecontrols the type of interpolation theplotmethod uses when plotting and resampling time series data. Invoke thetimeseriesmethodsetinterpmethodto change default linear interpolation to zero-order hold interpolation (staircase). This method creates a newtimeseriesobject, with which you can overwrite the original one if you want. For example, to cause time serieststo use zero-order hold interpolation, type the following:ts = ts.setinterpmethod('zoh');
Version History
Introduced before R2006a