plotpv
(To be removed) Plot perceptron input/target vectors
plotpv will be removed in a future release. For more information,
see Transition Legacy Neural Network Code to dlnetwork Workflows.
For advice on updating your code, see Version History.
Syntax
plotpv(P,T)

plotpv(P,T,V)
Description
plotpv(P,T) takes these inputs,
P |
|
T |
|
and plots column vectors in P with markers based on
T.
plotpv(P,T,V) takes an additional input,
V | Graph limits = |
and plots the column vectors with limits set by V.
Examples
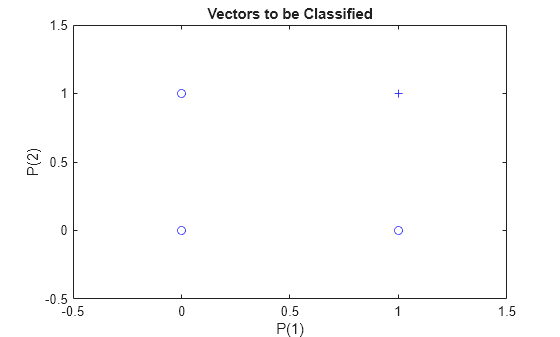
Plot Inputs and Targets for Perceptron
This example shows how to define and plot the inputs and targets for a perceptron.
p = [0 0 1 1; 0 1 0 1];
t = [0 0 0 1];
plotpv(p,t)
Version History
Introduced before R2006aSee Also
Time Series
Modeler | fitrnet (Statistics and Machine Learning Toolbox) | fitcnet (Statistics and Machine Learning Toolbox) | trainnet | trainingOptions | dlnetwork