Define Custom Metric Function
Note
This topic explains how to define a custom metric
function for your task. Use a custom metric function if Deep Learning Toolbox™ does not support the metric you need. For a list of built-in metrics in
Deep Learning Toolbox, see Metrics. If a built-in MATLAB® function satisfies the required syntax, then you can use that function
instead. For example, you can use the built-in l1loss
function to find the L1 loss. For information
about the required function syntax, see Create Custom Metric Function.
In deep learning, a metric is a numerical value that evaluates the performance of a deep learning network. You can use metrics to monitor how well a model is performing by comparing the model predictions to the ground truth. Common deep learning metrics are accuracy, F-score, precision, recall, and root mean squared error.
If Deep Learning Toolbox does not provide the metric that you need for your task, then in many cases
you can create a custom metric using a function. After you define the metric function, you
can specify the metric as the Metrics name-value argument in the trainingOptions function. Using a custom metric function for early stopping
and returning the best network is not supported for custom metric functions. If you require
early stopping or retuning the best network, then you must create a custom metric object
instead. For more information, see Define Custom Deep Learning Metric Object.
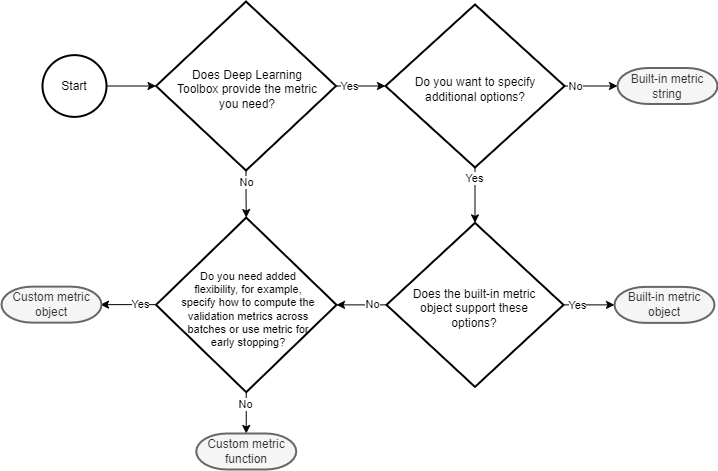
![]() How To Decide Which Metric Type To Use
How To Decide Which Metric Type To Use
Create Custom Metric Function
To create a custom metric function, you can use this template.
function val = myMetricFunction(Y,T)
% Evaluate custom metric.

% Inputs:
%          Y - Formatted dlarray of predictions
%          T - Formatted dlarray of targets
%
% Outputs:
%           val - Metric value
%
% Define the metric function here.
end
For categorical targets, the layout of the targets that the software passes to the metric depends on which function you want to use the metric with.
When using the metric with
trainnetand the targets are categorical arrays, if the loss function is"index-crossentropy", then the software automatically converts the targets to numeric class indices and passes them to the metric. For other loss functions, the software converts the targets to one-hot encoded vectors and passes them to the metric.When using the metric with
testnetand the targets are categorical arrays, if the specified metrics include"index-crossentropy"but do not include"crossentropy", then the software converts the targets to numeric class indices and passes them to the metric. Otherwise, the software converts the targets to one-hot encoded vectors and passes them to the metric.
Depending on your metric, you sometimes need to know the dimension labels before
computing the metric. Use the finddim
function to find dimensions with a specific label. For example, to average your metric
across batches, you need to know the batch dimension.
Note
When you have data in mini-batches, the software computes the metric for each mini-batch and then returns the average of those values. For some metrics, this behavior can result in a different metric value than if you compute the metric using the whole data set at once. In most cases, the values are similar. To use a custom metric that is not batch-averaged for the data, you must create a custom metric object. For more information, see Define Custom Deep Learning Metric Object.
To use the metric during training, specify the function handle as the
Metrics option of the trainingOptions
function.
trainingOptions("sgdm", ...
    Metrics=@myMetricFunction)
Example Regression Metric
For regression tasks, the function must accept a formatted dlarray
object of predictions and targets.
This code shows an example of a regression metric. This custom metric function computes the symmetric mean absolute percentage error (SMAPE) value given predictions and targets. This equation defines the SMAPE value:
where Y are the network predictions and T are the target responses.
function val = SMAPE(Y,T)
% Compute SMAPE value.

absoluteDifference = abs(Y-T);
absoluteAvg = (abs(Y) + abs(T))./2;
proportion = absoluteDifference./absoluteAvg;

val = 100*mean(proportion,"all");
end
Example Classification Metric
For classification tasks, the function must accept a formatted
dlarray object of predictions and targets encoded as one-hot
vectors. Each column in the vector represents a class and each row represents an
observation. For example, this code defines a one-hot vector. For more information, see
the onehotencode function.
Y =
     0     0     1
     1     0     0
     0     0     1
     0     1     0
This code shows an example of a classification metric. This custom metric function computes the macro-averaged error rate value given predictions and targets. This equation defines the macro error rate:
where TPi, TNi, FPi, and FNi represent the number of true positives, true negatives, false positives, and false negatives, respectively, in class i and K is the number of classes.
function val = errorRate(Y,T)
% Compute macro error rate value.

% Find the channel (class) dimension.
cDim = finddim(Y,"C");
bDim = finddim(Y,"B");

% Find the maximum score. This corresponds to the predicted
% class. Set the predicted class as 1 and all other classes as 0.
Y = Y == max(Y,[],cDim);

% Find the TP, FP, FN for this batch.
TP  = sum(Y & T, bDim);
FP = sum(Y & ~T, bDim);
FN = sum(~Y & T, bDim);
TN = sum(~Y & ~T, bDim);

% Compute the error rate value and average across each class.
val = mean((FP + FN)./(TP + TN + FP + FN));
end
Tip
If your metric has a fraction whose denominator value can be zero, you can add
eps to the denominator to prevent the metric returning a
NaN value.
See Also
trainingOptions | trainnet | dlnetwork