plotRoute
Display continuous route in geoplayer figure
Description
plotRoute(
uses player,lat,lon,Name,Value)Name,Value pair arguments to modify the visual style of
the route.
For example, plotRoute(player,[45 46],[0 0],'Color','k') plots
a route in a geoplayer figure as a black line.
Examples
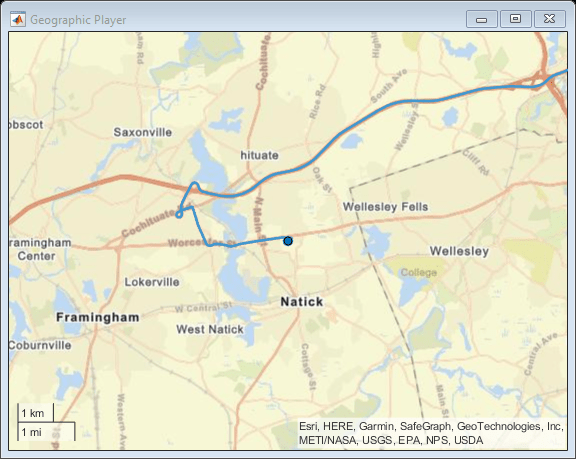
Load a sequence of latitude and longitude coordinates.
data = load('geoRoute.mat');Create a geographic player and set the zoom level to 12. Compared to the default zoom level, this zoom level zooms the map out by a factor of 8.
player = geoplayer(data.latitude(1),data.longitude(1),12);
Display the full route.
plotRoute(player,data.latitude,data.longitude);
Display the coordinates in a sequence. The circle marker indicates the current position.
for i = 1:length(data.latitude)
    plotPosition(player,data.latitude(i),data.longitude(i));
    pause(0.05)
end
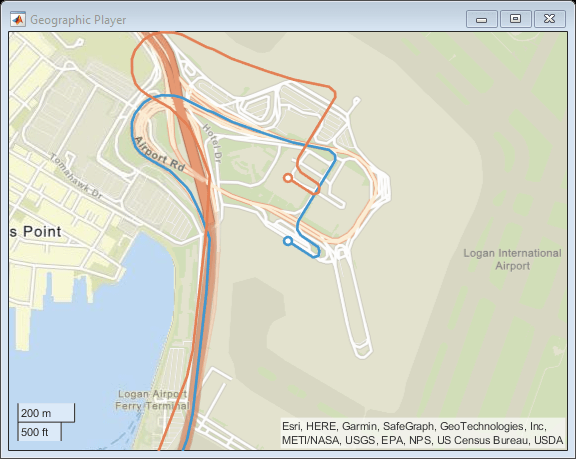
Plot multiple routes in a geographic player by calling plotRoute multiple times.
Load data for a route.
data = load('geoRoute.mat');Extract data for the first vehicle.
lat1 = data.latitude;
lon1 = data.longitude;
Create a synthetic route for the second vehicle. Add a small offset for better visibility.
lat2 = lat1 + 0.002; % add a small offset in degrees
lon2 = lon1;
Create a geoplayer object, specifying the starting coordinates for one of the routes.
player = geoplayer(lat1(1),lon1(1));
Plot the routes in the geographic player by calling plotRoute for each route.
plotRoute(player,lat1,lon1);
plotRoute(player,lat2,lon2);
Input Arguments
Name-Value Arguments
Specify optional pairs of arguments as
Name1=Value1,...,NameN=ValueN, where Name is
the argument name and Value is the corresponding value.
Name-value arguments must appear after other arguments, but the order of the
pairs does not matter.
Before R2021a, use commas to separate each name and value, and enclose
Name in quotes.
Example: 'Color','g'
Line color, specified as the comma-separated pair consisting of
'Color' and a color name, short color name, or
RGB triplet. By default, the line color is selected
automatically.
For a
custom color, specify an RGB triplet. An RGB triplet is a three-element row vector whose
elements specify the intensities of the red, green, and blue components of the color. The
intensities must be in the range [0,1]; for example, [0.4 0.6
0.7]. Alternatively, you can specify some common colors by name. This table lists
the named color options and the equivalent RGB triplet values.
| Color Name | Color Short Name | RGB Triplet | Appearance |
|---|---|---|---|
'red' | 'r' | [1 0 0] |
|
'green' | 'g' | [0 1 0] |
|
'blue' | 'b' | [0 0 1] |
|
'cyan'
| 'c'
| [0 1 1] |
|
'magenta' | 'm' | [1 0 1] |
|
'yellow' | 'y' | [1 1 0] |
|
'black' | 'k' | [0 0 0] |
|
'white' | 'w' | [1 1 1] |
|
Example: 'Color',[1 0 1]
Example: 'Color','m'
Example: 'Color','magenta'
Line width in points, specified as the comma-separated pair consisting
of 'LineWidth' and a positive number. 1 point = 1/72
inch.
Display the origin and destination points, specified as the
comma-separated pair consisting of 'ShowEndpoints'
and 'on' or 'off'. Specify
'on' to display the origin and destination
points. The origin marker is white and the destination marker is filled
with color.
Version History
Introduced in R2018a
See Also
geoplayer | plotPosition | reset | latlon2local | local2latlon
1 Alignment of boundaries and region labels are a presentation of the feature provided by the data vendors and do not imply endorsement by MathWorks®.