Euro NCAP Virtual Testing Using ISO Correlation
R2026bThis example shows application of the ISO/TS 18571:2024 metrics and rating workflow for the European New Car Assessment Programme (Euro NCAP®) 2026 virtual correlation testing.
Euro NCAP 2026 requires original equipment manufacturers (OEMs) to demonstrate that simulation models faithfully reproduce proving ground (PG) behavior before virtual test results can substitute for physical tests. For validating the simulation models, the protocol specifies an overall ISO correlation rating above 0.7, and the Key Performance Indicators (KPIs) must remain within scenario-specific tolerances. For more details on the ISO/TS 18571:2024 and its use-cases, refer to the Appendix section.
In this example, you:
Load and validate proving ground and simulation data files.
Filter the PG acceleration signal and align test regions using the AEB trigger point.
Compute Euro NCAP KPIs such as time-to-collide (TTC) at AEB, remaining distance, and impact speed.
Compute the ISO/TS 18571 correlation rating and grade.
Generate a PDF correlation report in accordance to the Euro NCAP standards.
You can use the workflow in this example to test any Euro NCAP 2026-2028 scenario [3] with appropriate simulation and proving ground data files. Refer to the Further Exploration section for more details.
For demonstration, this example uses a Car-to-Car Rear stationary (CCRs) scenario [2]. To know more about Euro NCAP 2026-2028 scenarios, see Euro NCAP Test Scenarios for Protocol Specification Years 2026–2028.
Load Proving Ground and Simulation Data
Specify the test name and paths to the PG and simulation log files. The PG file, CCRs50Overlap100PG.mat, should contain time-series signals recorded during an actual physical test on the proving ground. The simulation log file, CCRs50Overlap100Logsout.mat, contains a Simulink® logsout dataset produced by using the Euro NCAP Testing with RoadRunner Scenario example.
The testName specifies the Euro NCAP scenario name that determines which KPIs and threshold values to use when performing the ISO correlation test.
Note: To test for another Euro NCAP scenario, you must specify appropriate values of testName, pgFile, and simLogFile pertaining to that scenario. Supported file formats are CSV, XLXS, and MAT.
The helperExtractData helper function reads the PG and simulation MAT-files, extracts relevant signals, and resamples them to a common uniform time vector. The helper function returns:
pgData— Proving ground time-series signals including VUT speed, forward acceleration, and target-to-VUT distance, returned as a table.simLogData— Simulation time-series signals with the same variables as the PG data, returned as a table.sampleTime— Uniform sample time of the data, returned as a scalar. Units are in seconds.
testName = "CA FC CCRs";
pgFile = "CCRs50Overlap100PG.mat";
simLogFile = "CCRs50Overlap100Logsout.mat";
[pgData,simLogData,sampleTime] = helperExtractData(pgFile,simLogFile);
Visualize the raw acceleration signals of PG and simulation data.
helperVisualization("Raw",pgData,simLogData)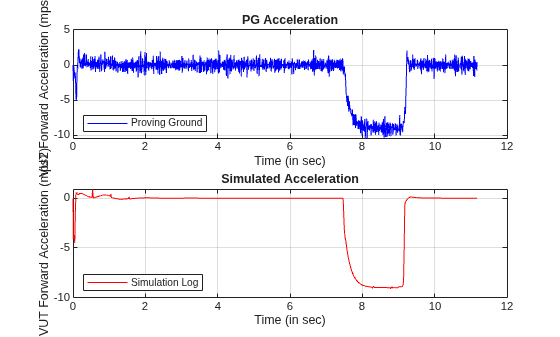
Filter Proving Ground Signal
Apply a 12-pole zero-phase Butterworth low-pass filter at 10 Hz to remove high-frequency noise while preserving braking event dynamics. The zero-phase (forward-backward) design ensures no time shift, which is critical for accurate ISO/TS 18571:2024 correlation [2]. Per Euro NCAP guidelines, filtering applies only to PG signals, whereas simulation signals are already band-limited by the solver.
Apply a 12-pole zero-phase Butterworth low-pass filter at 10 Hz to the PG acceleration signal by using the helperButterworthFilter helper function.
unfilteredAcceleration = [pgData.Time pgData.VUTForwardAcceleration_mps2];
filteredAcceleration = helperButterworthFilter(unfilteredAcceleration,sampleTime);
pgData.VUTForwardAcceleration_mps2 = filteredAcceleration;
Visualize the raw and filtered acceleration signals of PG data.
helperVisualization("Filtered",unfilteredAcceleration,filteredAcceleration)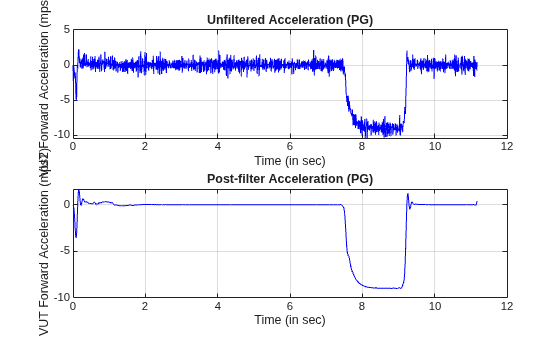
Align Test Regions
The simulation log can contain data before the vehicle enters the test zone. Trim it such that both logs start at the same target-to-VUT distance.
simLogData = simLogData(simLogData.TVDistance_m <= pgData.TVDistance_m(1),:);
Identify key time indices that define the ISO comparison region in both the PG and simulation data by using the helperTestProperties helper function.
The helper function returns pgTestProperties and simTestProperties as structures with these fields:
StartIdx— Index 200 ms before AEB activation, marking the start of the ISO comparison region, returned as a scalar.AEBIdx— Index at which emergency braking is triggered, returned as a scalar.EndIdx— Index at which the end-of-test condition is satisfied, marking the end of the ISO comparison region, returned as a scalar.
Additionally, the helper function returns:
windowLength— Number of samples in the ISO comparison region, equalized across PG and simulation such that both signals span the same duration, returned as a scalar.
[pgTestProperties,simTestProperties,windowLength] = helperTestProperties(pgData,simLogData,sampleTime);
Plot the aligned data with markers showing the ISO comparison region.
helperVisualization("Aligned",pgData,simLogData,pgTestProperties,sampleTime)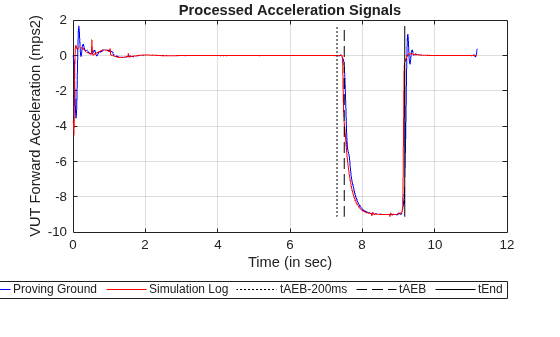
Compute Euro NCAP Key Performance Indicators
Compute the KPIs defined by the Euro NCAP Virtual Testing Protocol [3]. The protocol evaluates the error in these three indicators over the test region:
Time-to-Collision at AEB trigger (TTC_AEB).
Impact speed.
Remaining distance after stop.
Compute KPIs and validate them against Euro NCAP thresholds by using the helperEuroNCAPKPI helper function.
The helper function returns:
validation— KPI pass or fail results comparing PG and simulation values against Euro NCAP thresholds, returned as a table.accelStats— Acceleration statistical errors over the ISO comparison region, returned as a structure.
[validation,accelStats] = helperEuroNCAPKPI(pgData,simLogData,pgTestProperties,simTestProperties,testName);
Display the KPI results.
disp(validation)
            KPI               Error       Threshold    Pass
    ___________________    ___________    _________    _____

    "TTC_AEB"                -0.017781       0.2       true
    "ImpactSpeed"              0.44311         1       true
    "RemainingDistance"    -1.3882e-10         1       true
Compute ISO/TS 18571 Correlation Rating
The ISO/TS 18571:2024 [1] metric quantifies signal shape similarity using a weighted combination of four sub-ratings:
Corridor (40% weightage) — Does the simulation stay within a corridor around the reference signal?
Phase (20% weightage) — Is the signal time-aligned (computed using cross-correlation)?
Magnitude (20% weightage) — Are the amplitudes similar (computed using Dynamic Time Wrapping (DTW))?
Slope (20% weightage) — Are the signal derivatives similar?
The overall rating maps to one of these qualitative grade:
Excellent: > 0.94
Good: > 0.80
Fair: > 0.58
Poor: ≤ 0.58
Euro NCAP requires an ISO score above 0.7 for all test scenarios clusters [3]. Evaluate the VUT forward acceleration signal over the equalized comparison window.
Compute the ISO correlation rating and corridor bounds by using the helperCorrelation helper function.
The helper function returns:
rating— Overall ISO/TS 18571:2024 similarity rating, returned as a scalar.grade— Qualitative grade derived from the overall rating, returned as"Poor","Fair","Good", or"Excellent".ratingInfo— Individual sub-ratings and their weights for Corridor, Phase, Magnitude, and Slope, returned as a table.innerCorridor— Lower and upper bounds of the inner corridor computed from the reference signal, returned as a matrix.outerCorridor— Lower and upper bounds of the outer corridor computed from the reference signal, returned as a matrix.
ref = pgData{pgTestProperties.StartIdx:pgTestProperties.EndIdx,["Time" "VUTForwardAcceleration_mps2"]};
comp = simLogData{simTestProperties.StartIdx:simTestProperties.EndIdx,["Time" "VUTForwardAcceleration_mps2"]};
[rating,grade,ratingInfo,innerCorridor,outerCorridor] = helperCorrelation(ref,comp);
Display the ISO rating and grade.
fprintf("ISO 18571 Rating: %.4f\nGrade: %s\n",rating,grade)ISO 18571 Rating: 0.9760 Grade: Excellent
Display the individual sub-ratings and their weights.
disp(ratingInfo)
      Method       Rating    Weight
    ___________    ______    ______

    "Corridor"     0.995      0.4
    "Phase"            1      0.2
    "Magnitude"    0.992      0.2
    "Slope"        0.899      0.2
Plot the comparison signal with inner and outer corridors overlaid on the reference signal by using the helperVisualization helper function. The figure displays the inner corridor in green and the outer corridor in yellow.
helperVisualization("Corridors",ref,comp,innerCorridor,outerCorridor,rating,grade,testName)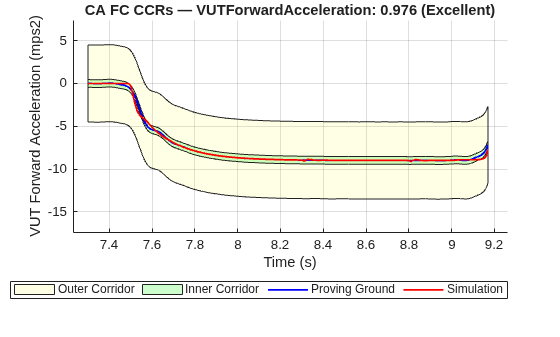
Generate Correlation Report
Euro NCAP mandates a correlation report as part of the virtual testing submission, evidencing that simulation models replicate proving ground behavior. Assemble the figures and results into a multi-page PDF suitable for inclusion in that report.
reportPath = fullfile(pwd,testName + "_CorrelationReport.pdf");Create a PDF report by using the helperGenerateReport helper function.
helperGenerateReport(reportPath,testName,ratingInfo,grade,pgData,simLogData,unfilteredAcceleration,filteredAcceleration, ...
    pgTestProperties,simTestProperties,ref,comp,innerCorridor,outerCorridor,accelStats,sampleTime,windowLength);
Report saved: /tmp/Bdoc26b_3351752_878429/tpcab88566/variantgenerator-ex72973078/CA FC CCRs_CorrelationReport.pdf
Further Exploration
This example demonstrates correlation for a single CCRs [2] test case. The Euro NCAP OEM in-house qualification (refer, section 5.1.1 of [3]) requires correlation across multiple scenario clusters, each with mandatory corner cases:
Frontal-Longitudinal (CCRs) — Four corner cases with 3-5 additional cases from the standard test matrix.
Frontal-Turning (CCFtap) — Four corner cases at combinations of VUT speed and GVT speed.
Frontal-Crossing (CPNA) — Four corner cases with 3-5 additional cases from the standard test matrix.
Frontal-Crossing (CPNCO) — Two corner cases with one additional case.
To apply this workflow to other Euro NCAP cluster scenarios, change testName and specify corresponding proving ground and simulation data files.
Appendix
The ISO/TS 18571 [1] standard provides an objective, analyst-independent method for comparing time-domain signals aimed at vehicle safety applications. The standard is validated against various loading cases under different types of physical loads such as forces, moments, and accelerations. The standard produces an overall rating from four sub-metrics: corridor, phase, magnitude, and slope. Key engineering applications include:
Regulatory compliance — Meeting consumer testing standards (such as Euro NCAP) that require objective simulation validation.
Dummy comparison — Comparing dummy sensor data (head acceleration, chest deflection) between physical tests and simulations.
Component testing — Corroborating laboratory drop tests or sled tests of components (for example, airbags, seats) against virtual design loops.
Design optimization — Scoring how design modifications alter crash pulse shapes during early-stage virtual vehicle development.
References
[1] ISO/TS 18571:2024, "Road vehicles - Objective rating metric for non-ambiguous signals." https://www.iso.org/standard/85791.html
[2] European New Car Assessment Programme (Euro NCAP). Protocol – Crash Avoidance Frontal Collisions. Version 1.1. Euro NCAP, October 2025. https://cdn.euroncap.com/cars/assets/euro_ncap_protocol_crash_avoidance_frontal_collisions_v11_bc661b4bdc.pdf
[3] European New Car Assessment Programme (Euro NCAP). Protocol – Safe Driving and Crash Avoidance Virtual Testing. Version 1.0. Euro NCAP, March 2025. https://cdn.euroncap.com/cars/assets/euro_ncap_supporting_protocol_safe_driving_crash_avoidance_virtual_testing_v10_bb5738fef8.pdf
Helper Functions
% helperButterworthFilter - Apply a 12-pole zero-phase Butterworth low-pass filter at 10 Hz to remove high-frequency noise from the input acceleration signal.
function filteredSignal = helperButterworthFilter(unfilteredSignal,sampleTime)
    cutoffFreq = 10; % Unit is in Hz.
    [b,a] = butter(6,cutoffFreq*sampleTime*2,"low");
    filteredSignal = filtfilt(b,a,unfilteredSignal(:,2));
end

% helperTestProperties - Identify AEB trigger index, 200 ms pre-AEB window, and end-of-test index for PG and simulation data, and equalize the comparison window length.
function [pgTestProperties,simTestProperties,windowLength] = helperTestProperties(data1,data2,sampleTime)
    dataArr = {data1 data2};
    [t200msBeforeAebIdx,aebIdx,tEndIdx] = deal(NaN(1,2));
    for i = 1:2
        data = dataArr{i};
        [~,maxSpdIdx] = max(data.VUTSpeed_kph);
        braking3Idx = maxSpdIdx + find(data.VUTForwardAcceleration_mps2(maxSpdIdx:end) < -3,1,"first") - 1;
        onsetIdx = find(data.VUTForwardAcceleration_mps2(maxSpdIdx:braking3Idx) >= -1,1,"last");
        aebIdx(i) = maxSpdIdx + onsetIdx - 1;
        t200msBeforeAebIdx(i) = aebIdx(i) - round(0.2/sampleTime);
        acceptedSpeedTol = 1e-3;
        pitchMovementIdx = aebIdx(i) + find(data.VUTForwardAcceleration_mps2(aebIdx(i):end) >= 0,1,"first") - 1;
        if any(data.VUTSpeed_kph(aebIdx(i):pitchMovementIdx) <= acceptedSpeedTol)
            tEndIdx(i) = aebIdx(i) + find(data.VUTSpeed_kph(aebIdx(i):pitchMovementIdx) <= acceptedSpeedTol,1,"first") - 1;
        else
            tEndIdx(i) = pitchMovementIdx;
        end
    end
    if tEndIdx(2) - t200msBeforeAebIdx(2) >= tEndIdx(1) - t200msBeforeAebIdx(1)
        windowLength = tEndIdx(1) - t200msBeforeAebIdx(1) + 1;
    else
        windowLength = tEndIdx(2) - t200msBeforeAebIdx(2) + 1;
    end
    tEqualizerIdx(1) = t200msBeforeAebIdx(1) + windowLength - 1;
    tEqualizerIdx(2) = t200msBeforeAebIdx(2) + windowLength - 1;
    pgTestProperties = struct("StartIdx",t200msBeforeAebIdx(1),"AEBIdx",aebIdx(1),"EndIdx",tEqualizerIdx(1));
    simTestProperties = struct("StartIdx",t200msBeforeAebIdx(2),"AEBIdx",aebIdx(2),"EndIdx",tEqualizerIdx(2));
end

% helperPrepareCorrelationInfo - Assemble ISO/TS 18571 sub-ratings, statistical errors, and corridor metrics into a summary table for the PDF report.
function t = helperPrepareCorrelationInfo(rating,ratingBreakdown,dt,nSamples,kpiStats,fractionInsideCorridor)
    z = ratingBreakdown.Rating(ratingBreakdown.Method=="Corridor");
    ep = ratingBreakdown.Rating(ratingBreakdown.Method=="Phase");
    em = ratingBreakdown.Rating(ratingBreakdown.Method=="Magnitude");
    es = ratingBreakdown.Rating(ratingBreakdown.Method=="Slope");
    col1 = ["Samples","dt(s)","RMS error","MAE","Max Abs error","Percentage inside corridor", ...
        "Z - Corridor rating","EP - Phase rating","EM - Magnitude rating","ES - Slope rating","R - Overall rating"];
    col2 = [nSamples dt kpiStats.rmse kpiStats.meanAE kpiStats.maxAE fractionInsideCorridor ...
        z ep em es rating];
    t = table(col1',col2');
    t.Properties.VariableNames = ["Metric" "Value"];
end

% helperGenerateFigureForReport - Generate all figures (raw, filtered, aligned, trimmed, corridor) used in the PDF correlation report.
function fig = helperGenerateFigureForReport(pgData,simLogData,unfilteredAccelData,filteredAccelData,sampleTime, ...
    pg200msBeforeAEBIdx,sim200msBeforeAEBIdx,pgAEBIdx,pgEqualizerIdx,simEqualizerIdx,aRef,aComp,innerCorridor, ...
    outerCorridor,rating,grade,testName)
    [figRawPG,figFilteredPG] = HelperReportExhibit.rawData(unfilteredAccelData,[unfilteredAccelData(:,1) filteredAccelData]);
    figAligned = HelperDataExhibit.plotAlignedData(pgData,simLogData,pg200msBeforeAEBIdx, ...
        pgAEBIdx,pgEqualizerIdx,sampleTime,FigureVisibility="off");
    figTrimmed = HelperReportExhibit.trimmedData(pgData,simLogData,pg200msBeforeAEBIdx, ...
        pgEqualizerIdx,sim200msBeforeAEBIdx,simEqualizerIdx,sampleTime);
    figTrimmedWithMarkers = HelperReportExhibit.trimmedData(pgData,simLogData, ...
        pg200msBeforeAEBIdx,pgEqualizerIdx,sim200msBeforeAEBIdx,simEqualizerIdx,sampleTime,ShowMarkers=true);
    figCorridors = HelperDataExhibit.plotWithCorridors(aRef(:,1),aRef(:,2),aComp(:,2), ...
        innerCorridor,outerCorridor,"VUT Forward Acceleration (mps2)",rating,grade,testName,FigureVisibility="off");
    fig = [figRawPG figFilteredPG figAligned figTrimmedWithMarkers figTrimmed figCorridors];
end

% helperGenerateReport - Create a PDF correlation report containing the summary table and all diagnostic figures.
function report = helperGenerateReport(reportPath,testName,ratingInfo,grade,pgData,simLogData,unfilteredAcceleration,filteredAcceleration, ...
    pgTestProperties,simTestProperties,ref,comp,innerCorridor,outerCorridor,accelStats,sampleTime,windowLength)
        rating = sum(ratingInfo.Rating.*ratingInfo.Weight);
        fractionInsideCorridor = 1 - (sum(comp(:,2) < outerCorridor(:,1) | ...
            comp(:,2) > outerCorridor(:,2)) / size(comp,1));
        correlationInfo = helperPrepareCorrelationInfo(rating,ratingInfo,sampleTime, ...
            windowLength,accelStats,fractionInsideCorridor);
        fig = helperGenerateFigureForReport(pgData,simLogData,unfilteredAcceleration,filteredAcceleration,sampleTime, ...
            pgTestProperties.StartIdx,simTestProperties.StartIdx,pgTestProperties.AEBIdx,pgTestProperties.EndIdx,simTestProperties.EndIdx, ...
            ref,comp,innerCorridor,outerCorridor,rating,grade,testName);
        report = HelperCorrelationReport(reportPath);
        report.addTable(correlationInfo,PageTitle="Correlation Report - " + testName, ...
            Header="ISO/TS 18571:2024 Score Results");
        report.addFigure([fig(1) fig(2)],PageTitle="1. Preprocessing — Filtering", ...
            Header=["Proving Ground - Raw Acceleration" "Proving Ground - Post Filtered Acceleration"]);
        report.addFigure([fig(3) fig(4)],PageTitle="2. Preprocessing — tAEB Time Alignment and Trimming", ...
            Header=["Aligned PG vs Simulation - Acceleration" "Trimmed Acceleration - PG vs Simulation"]);
        report.addFigure([fig(5) fig(6)],PageTitle="3. ISO/TS 18571:2024 Calculation", ...
            Header=["ISO Input - VUT Forward Acceleration" "ISO Output - VUT Forward Acceleration with Corridors"], ...
            Caption=["" sprintf("Rating: %.4f (%s)",rating,grade)]);
        report.close();
end

