SoC Blockset Task Profiling
When you use the SoC Blockset™ product with the STM32F4xx based boards, the boards can use task profiler to measure the timing of the interrupts on the processor. To profile interrupt timing, follow these steps.
Create or open an STM32™ Microcontroller Blockset model.
On the Hardware tab, click Hardware Settings.
On the Code Generation > Verification > Code execution time profiling pane, select Measure task execution time. Close the Configuration Parameters window.
On the Hardware tab, enable interrupt profiling by clicking Profile Tasks.
Run the model on the hardware board by clicking Monitor & Tune.
When the run completes, open the Simulation Data Inspector to see the data signals and the interrupts on the STMicroelectronics® processor. This figure shows a sample of the expected interrupt data shown. For more information on tasks in the Simulation Data Inspector, see Task Visualization in Simulation Data Inspector (SoC Blockset).
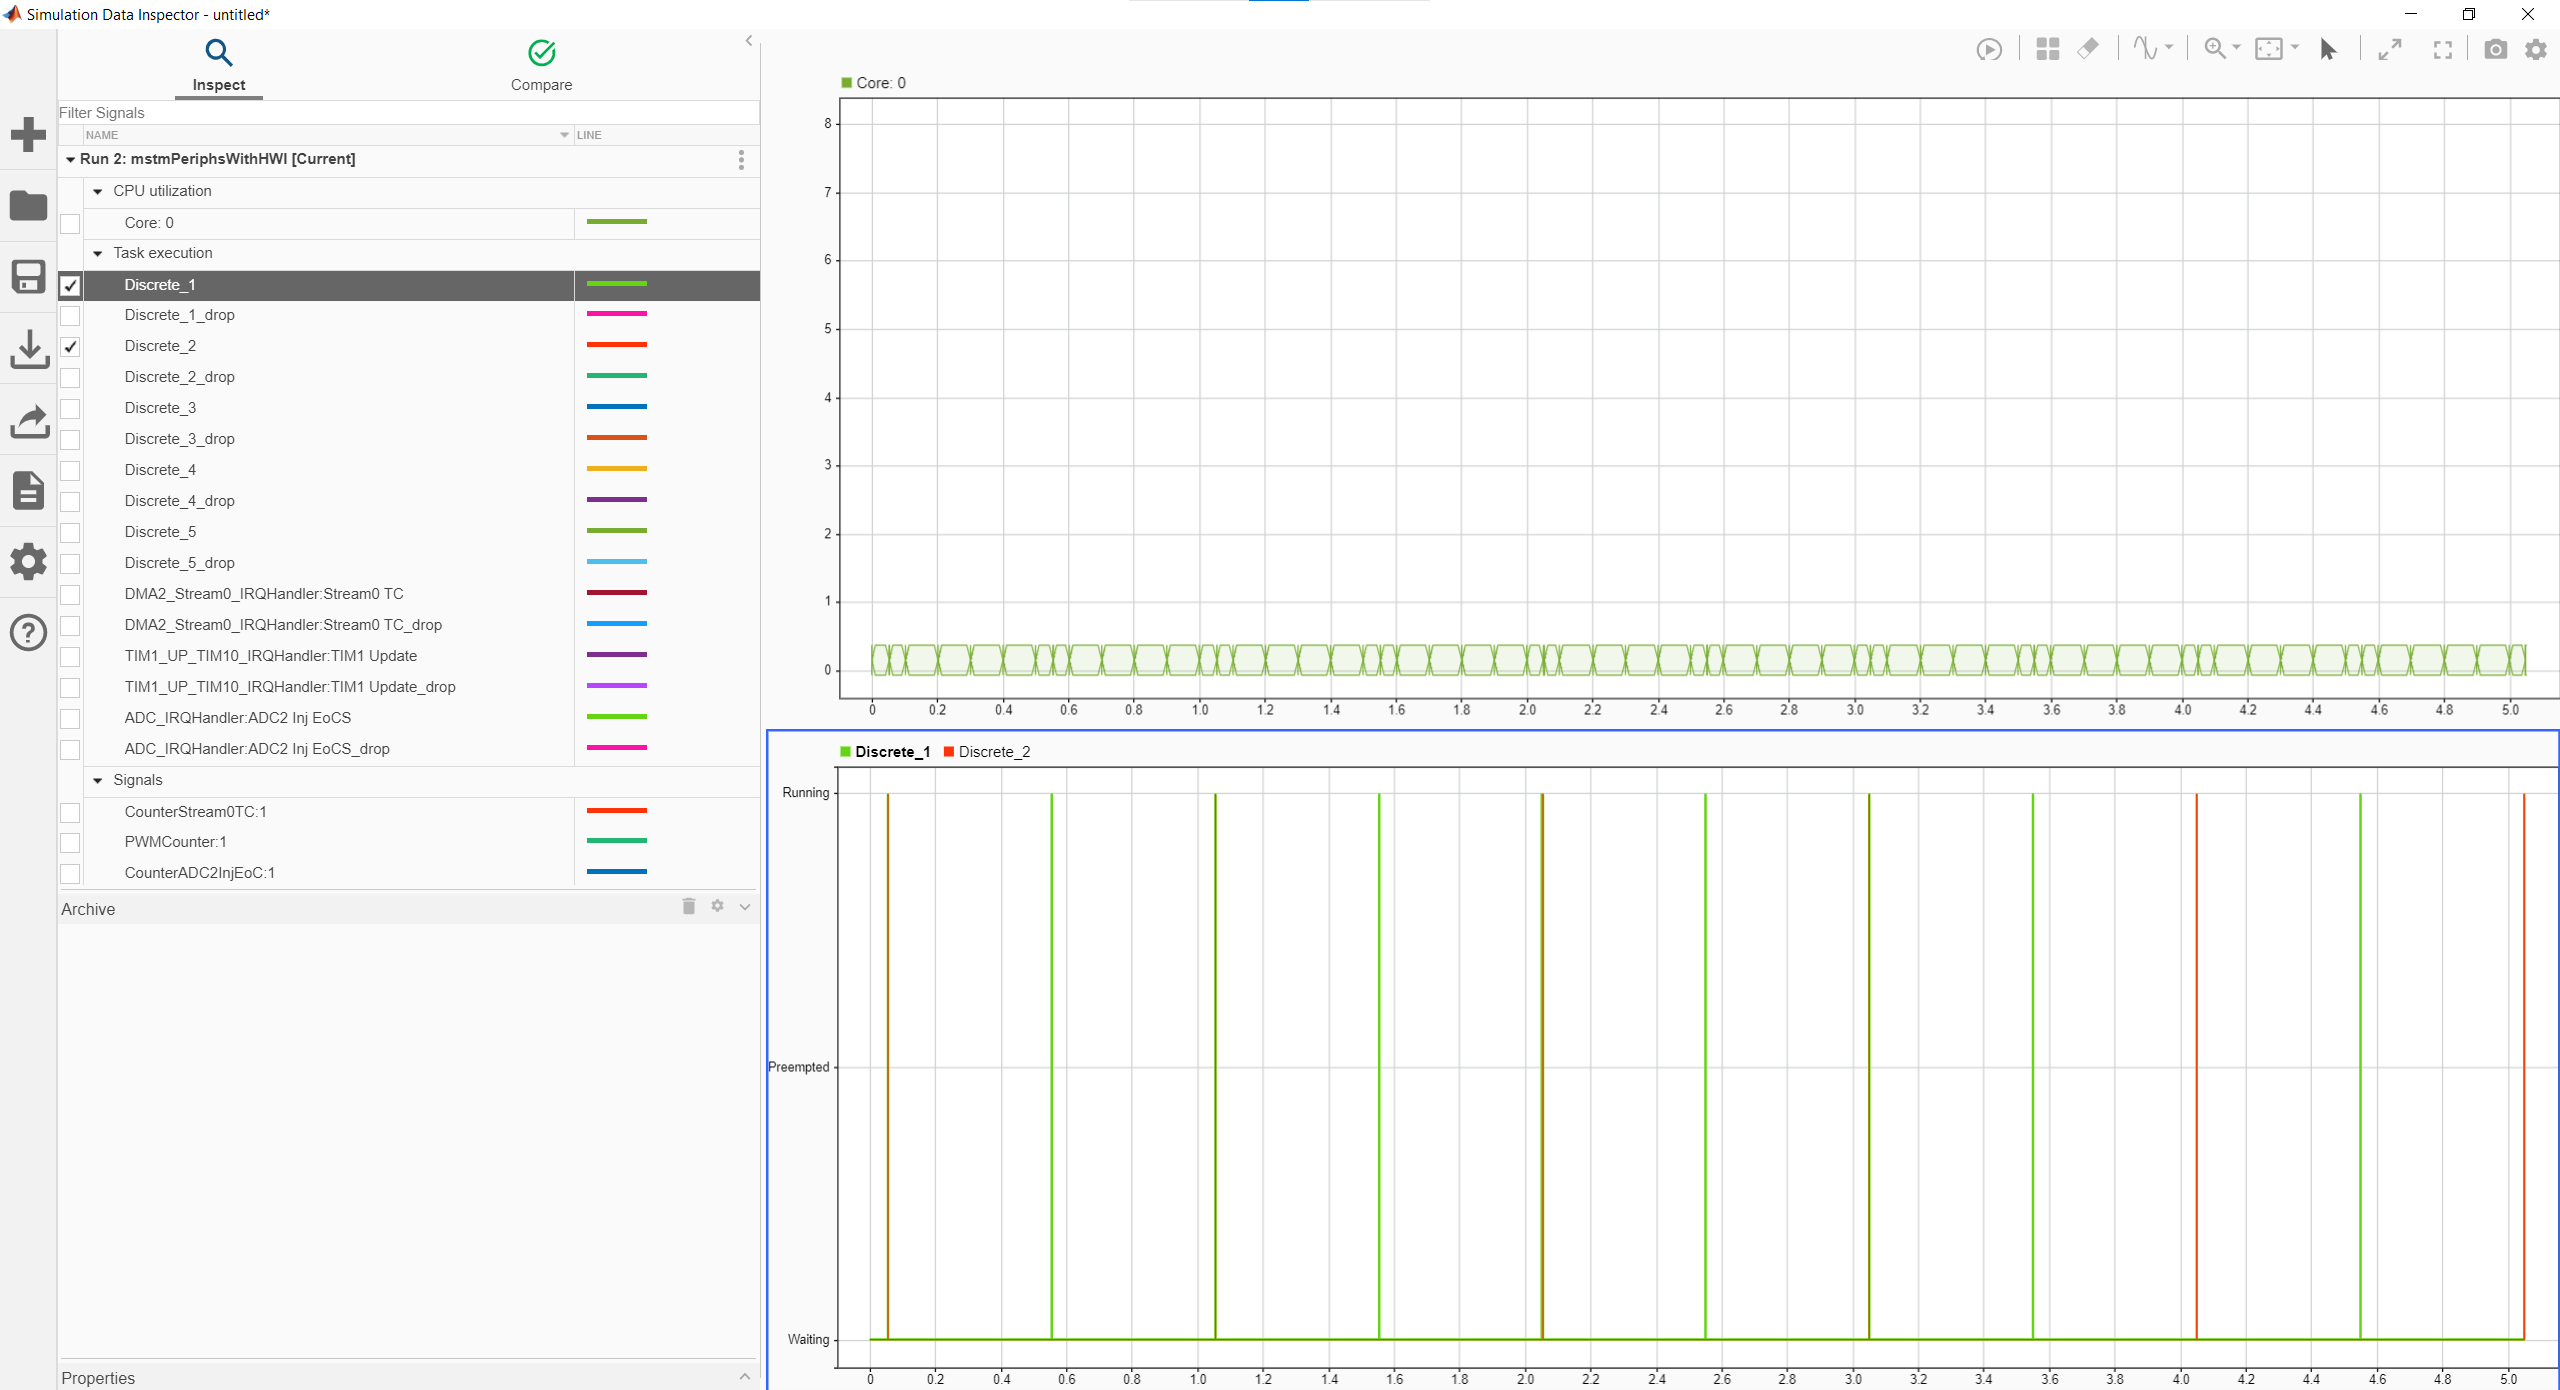
Using the data collected in the Simulation Data Inspector, you can use the Performance Report (SoC Blockset) tool to generate an aggregation of the timing data from the interrupts.
See Also
Performance Report (SoC Blockset) | Simulation Data Inspector