Radon Transform
The radon function calculates projections
of an image matrix along specified directions.
A projection of a two-dimensional function f(x,y) is a set of
line integrals. The radon function computes the line integrals from
multiple sources along parallel paths, or beams, in a certain direction. The beams are
spaced 1 pixel unit apart. To represent an image, the radon function
takes multiple, parallel-beam projections of the image from different angles by rotating
the source around the center of the image. The following figure shows a single
projection at a specified rotation angle.
Parallel-Beam Projection at Rotation Angle Theta
For example, the line integral of f(x,y) in the vertical direction is the projection of f(x,y) onto the x-axis; the line integral in the horizontal direction is the projection of f(x,y) onto the y-axis. The following figure shows horizontal and vertical projections for a simple two-dimensional function.
Horizontal and Vertical Projections of a Simple Function
Projections can be computed along any angle theta (θ). In general, the Radon transform of f(x,y) is the line integral of f parallel to the y´-axis
where
The following figure illustrates the geometry of the Radon transform.
Geometry of the Radon Transform
Note
For information about creating projection data from line integrals along paths
that radiate from a single source, called fan-beam projections, see Fan-Beam Projection. To convert
parallel-beam projection data to fan-beam projection data, use the
para2fan function.
Plot the Radon Transform of an Image
This example shows how to compute the Radon transform of an image for a specific set of rotations angles using the radon function.
Create a small sample image that consists of a single square object, and display the image.
I = zeros(100,100);
I(25:75,25:75) = 1;
imshow(I)

Calculate the Radon transform of the image for the angles 0° and 30°. The function returns, R, in which the columns contain the Radon transform for each angle in theta. The function also returns the vector, xp, which contains the corresponding coordinates along the x-axis. The center pixel of I is defined to be floor((size(I)+1)/2), which is the pixel on the x-axis corresponding to x' = 0.
theta = [0 30];
[R,xp] = radon(I,theta);
Plot the transform at 0°.
figure
plot(xp,R(:,1))
title("Radon Transform of Square Function at 0 Degrees")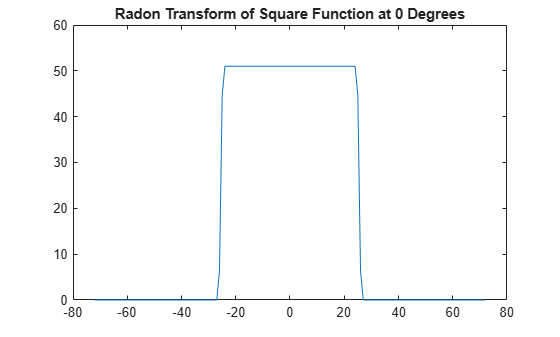
Plot the transform at 30°.
plot(xp,R(:,2));
title("Radon Transform of Square Function at 30 Degrees")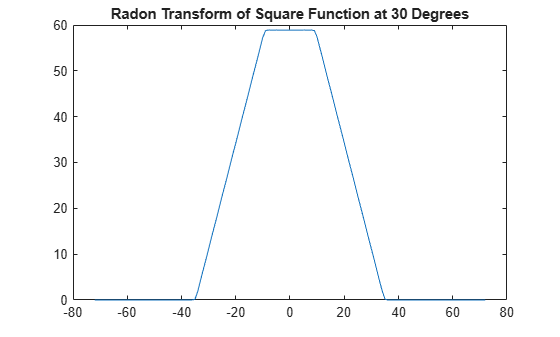
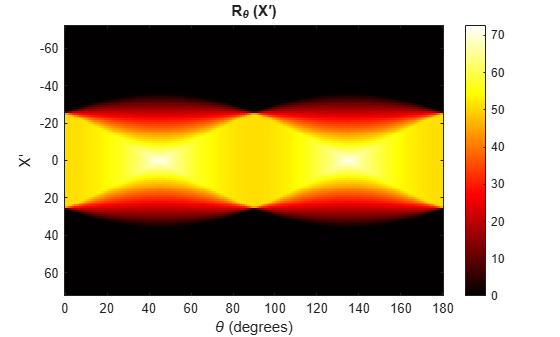
The Radon transform is often calculated for a large number of angles and displayed as an image. Calculate the Radon transform for the square image at angles from 0° to 180°, in 1° increments.
theta = 0:180;
[R,xp] = radon(I,theta);
Display the 2-D Radon transform as a sinogram.
figure
imagesc(theta,xp,R)
title("R_{\theta} (X\prime)")
xlabel("\theta (degrees)")
ylabel("X\prime")
set(gca,"XTick",0:20:180)
colormap(hot)
colorbar