Create Geospatial Tables
Vector data uses points, lines, polygons, and their nonspatial attributes to describe real-world events, locations and objects. For example, you can use a point and timestamp attribute to represent a tsunami event, a line and name attribute to represent a river location, and a polygon and age attribute to represent a building.
You can represent vector data by using geospatial tables. A geospatial
table is a table or timetable object
that contains a Shape variable and attribute variables.
The
Shapevariable contains 2-D information about point, line, and polygon shapes. TheShapevariable can contain combinations of shape types, but all the shapes must have the same coordinate reference system (CRS). TheShapevariable must be the first variable of the table.Represent shapes with coordinates in geographic CRSs by using
geopointshape,geolineshape, andgeopolyshapeobjects. TheGeographicCRSproperty of each object contains the CRS as ageocrsobject.Represent shapes with coordinates in projected CRSs by using
mappointshape,maplineshape, andmappolyshapeobjects. TheProjectedCRSproperty of each object contains the CRS as aprojcrsobject.The attribute variables contain data such as names, classifications, and measurements.
For example, you can import the shapefile concord_roads.shp, which
represents a road network in Concord, MA, as a geospatial table. Each row of the table
contains a maplineshape object with information about the line shape
and several attributes with information such as the street name, road class, and road
length.
There are multiple ways to create geospatial tables. You can:
Read a geospatial table from a vector data file by using the
readgeotablefunction.Read a table or timetable from a file containing pointwise data or well-known text (WKT) string representations of geometry by using the
readtableorreadtimetablefunction, and then convert the table to a geospatial table by using thetable2geotablefunction.Create a geospatial table by using the
tableortimetablefunction. For more information about creating tables, see Create Tables and Assign Data to Them. For more information about creating timetables, see Create Timetables.
These examples show how to create geospatial tables using each of the listed processes.
Read Geospatial Table from File
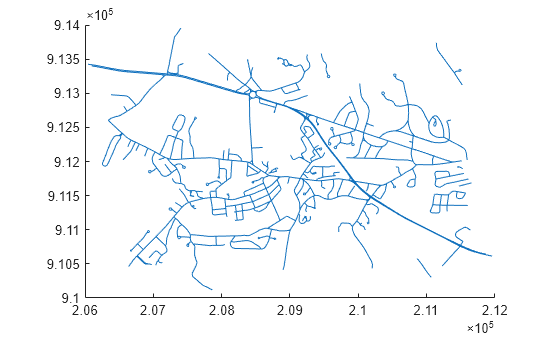
Read a shapefile containing a network of road segments in Concord, MA as a geospatial table by using the readgeotable function.
GT = readgeotable("concord_roads.shp");View the first eight rows of the geospatial table. The Shape variable contains information about the shapes. For this example, all the shapes are lines. The other variables contain attribute data.
head(GT)
       Shape         STREETNAME      RT_NUMBER    CLASS    ADMIN_TYPE    LENGTH
    ____________    _____________    _________    _____    __________    ______

    maplineshape    ""                  ""          6          0         67.264
    maplineshape    "WRIGHT FARM"       ""          5          0         72.178
    maplineshape    "WRIGHT FARM"       ""          5          0         43.965
    maplineshape    "WRIGHT FARM"       ""          5          0         109.65
    maplineshape    "WRIGHT FARM"       ""          5          0         18.019
    maplineshape    ""                  ""          6          0         58.444
    maplineshape    "WRIGHT FARM"       ""          5          0         16.925
    maplineshape    ""                  ""          6          0         55.633
View the projected CRS for the line shapes. All shapes in a geospatial table must have the same CRS.
GT.Shape.ProjectedCRS
ans =
  projcrs with properties:

                    Name: "NAD83 / Massachusetts Mainland"
           GeographicCRS: [1×1 geocrs]
        ProjectionMethod: "Lambert Conic Conformal (2SP)"
              LengthUnit: "meter"
    ProjectionParameters: [1×1 map.crs.ProjectionParameters]
View information about the line shape in the first row of the table.
GT.Shape(1)
ans =
  maplineshape with properties:

                NumParts: 1
                Geometry: "line"
    CoordinateSystemType: "planar"
            ProjectedCRS: [1×1 projcrs]
Display the roads.
mapshow(GT)
Create Geospatial Table from Table
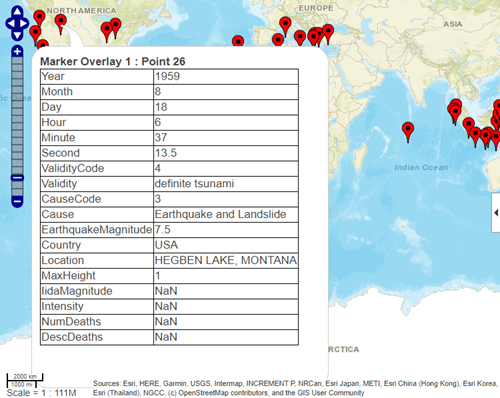
Read data about tsunami events as a table by using the readtable function. The coordinates of the tsunami source locations are in the Latitude and Longitude table variables.
T = readtable("tsunamis.xlsx");Convert the table to a geospatial table by using the table2geotable function. The function detects the Latitude and Longitude variables and uses them to create the Shape variable of the table.
GT = table2geotable(T);
View the Shape variable of the geospatial table. The tsunami source locations are points in a geographic coordinate system.
GT.Shape
ans =
  162×1 geopointshape array with properties:

               NumPoints: [162×1 double]
                Latitude: [162×1 double]
               Longitude: [162×1 double]
                Geometry: "point"
    CoordinateSystemType: "geographic"
           GeographicCRS: []
Plot the source locations on a map.
geoplot(GT)
Create Geospatial Table from Arrays
Create a geospatial table containing the locations and names of cities.
Create an array of geopointshape objects from column vectors of latitude and longitude coordinates. Specify the geographic CRS as the World Geodetic System of 1984, which has the EPSG code 4326.
lats = [35.7082 -22.8842 51.5074 39.9042 37.9838]';
lons = [139.6401 -43.3882 -0.1278 116.4074 23.7275]';
shape = geopointshape(lats,lons);
shape.GeographicCRS = geocrs(4326)
shape =
  5×1 geopointshape array with properties:

               NumPoints: [5×1 double]
                Latitude: [5×1 double]
               Longitude: [5×1 double]
                Geometry: "point"
    CoordinateSystemType: "geographic"
           GeographicCRS: [1×1 geocrs]
Specify the names of the cities as a column vector.
names = ["Tokyo" "Rio de Janeiro" "London" "Beijing" "Athens"]';
Create the geospatial table. The Shape variable contains the geopointshape objects and the Name variable contains the names.
GT = table(shape,names,VariableNames=["Shape" "Name"])
GT=5×2 table
             Shape                   Name
    _______________________    ________________

    (35.7082°N, 139.6401°E)    "Tokyo"
    (22.8842°S,  43.3882°W)    "Rio de Janeiro"
    (51.5074°N,   0.1278°W)    "London"
    (39.9042°N, 116.4074°E)    "Beijing"
    (37.9838°N,  23.7275°E)    "Athens"
Verify that the table is a geospatial table.
isgeotable(GT)
ans = logical
   1
Tips
Some functions that accept geospatial tables as input require the geospatial table
to contain shapes of a specific type. For example, the kmlwrite
function only accepts geospatial tables that contain geographic point, line, or
polygon shapes.