Create Tables and Assign Data to Them
Tables are suitable for column-oriented data such as tabular data from text files or spreadsheets. Tables store columns of data in variables. The variables in a table can have different data types, though all of the variables must have the same number of rows. However, table variables are not restricted to storing only column vectors. For example, a table variable can contain a matrix with multiple columns as long as it has the same number of rows as the other table variables.
In MATLAB®, you can create tables and assign data to them in several ways.
Create a table from input arrays by using the
tablefunction.Add variables to an existing table by using dot notation.
Assign variables to an empty table.
Preallocate a table and fill in its data later.
Convert variables to tables by using the
array2table,cell2table, orstruct2tablefunctions.Read a table from file by using the
readtablefunction.Import a table using the Import Tool.
The way you choose depends on the nature of your data and how you plan to use tables in your code.
Create Tables from Input Arrays
You can create a table from arrays by using the table function. For example, create a small table with data for five patients.
First, create six column-oriented arrays of data. These arrays have five rows because there are five patients. (Most of these arrays are 5-by-1 column vectors, while BloodPressure is a 5-by-2 matrix.)
LastName = ["Sanchez";"Johnson";"Zhang";"Diaz";"Brown"];
Age = [38;43;38;40;49];
Smoker = [true;false;true;false;true];
Height = [71;69;64;67;64];
Weight = [176;163;131;133;119];
BloodPressure = [124 93; 109 77; 125 83; 117 75; 122 80];
Now create a table, patients, as a container for the data. In this call to the table function, the input arguments use the workspace variable names for the names of the variables in patients.
patients = table(LastName,Age,Smoker,Height,Weight,BloodPressure)
patients=5×6 table
    LastName     Age    Smoker    Height    Weight    BloodPressure
    _________    ___    ______    ______    ______    _____________

    "Sanchez"    38     true        71       176       124     93
    "Johnson"    43     false       69       163       109     77
    "Zhang"      38     true        64       131       125     83
    "Diaz"       40     false       67       133       117     75
    "Brown"      49     true        64       119       122     80
The table is a 5-by-6 table because it has six variables. As the BloodPressure variable shows, a table variable itself can have multiple columns. This example shows why tables have rows and variables, not rows and columns.
Add Variable to Table Using Dot Notation
Once you have created a table, you can add a new variable at any time by using dot notation. Dot notation refers to table variables by name, T.varname, where T is the table and varname is the variable name. This notation is similar to the notation you use to access and assign data to the fields of a structure.
For example, add a BMI variable to patients. Calculate body mass index, or BMI, using the values in patients.Weight and patients.Height. Assign the BMI values to a new table variable.
patients.BMI = (patients.Weight*0.453592)./(patients.Height*0.0254).^2
patients=5×7 table
    LastName     Age    Smoker    Height    Weight    BloodPressure     BMI
    _________    ___    ______    ______    ______    _____________    ______

    "Sanchez"    38     true        71       176       124     93      24.547
    "Johnson"    43     false       69       163       109     77      24.071
    "Zhang"      38     true        64       131       125     83      22.486
    "Diaz"       40     false       67       133       117     75      20.831
    "Brown"      49     true        64       119       122     80      20.426
Assign Variables to Empty Table
Another way to create a table is to start with an empty table and assign variables to it. For example, re-create the table of patient data, but this time assign variables using dot notation.
First, create an empty table, patients2, by calling table without arguments.
patients2 = table
patients2 =

  0×0 empty table
Next, create a copy of the patient data by assigning variables. Table variable names do not have to match array names, as shown by the Name and BP table variables.
patients2.Name = LastName;
patients2.Age = Age;
patients2.Smoker = Smoker;
patients2.Height = Height;
patients2.Weight = Weight;
patients2.BP = BloodPressure
patients2=5×6 table
      Name       Age    Smoker    Height    Weight        BP
    _________    ___    ______    ______    ______    __________

    "Sanchez"    38     true        71       176      124     93
    "Johnson"    43     false       69       163      109     77
    "Zhang"      38     true        64       131      125     83
    "Diaz"       40     false       67       133      117     75
    "Brown"      49     true        64       119      122     80
Preallocate Table and Fill Rows
Sometimes you know the sizes and data types of the data that you want to store in a table, but you plan to assign the data later. Perhaps you plan to add only a few rows at a time. In that case, preallocating space in the table and then assigning values to empty rows can be more efficient.
For example, to preallocate space for a table to contain time and temperature readings at different stations, use the table function. Instead of supplying input arrays, specify the sizes and data types of the table variables. To give them names, specify the VariableNames name-value argument. Preallocation fills table variables with default values that are appropriate for their data types.
sz = [4 3];
varTypes = ["double" "datetime" "string"];
varNames = ["Temperature" "Time" "Station"];
temps = table(Size=sz,VariableTypes=varTypes,VariableNames=varNames)
temps=4×3 table
    Temperature    Time     Station
    ___________    ____    _________

         0         NaT     <missing>
         0         NaT     <missing>
         0         NaT     <missing>
         0         NaT     <missing>
One way to assign or add a row to a table is to assign a cell array to a row. If the cell array is a row vector and its elements match the data types of their respective variables, then the assignment converts the cell array to a table row. However, you can assign only one row at a time using cell arrays. Assign values to the first two rows.
temps(1,:) = {75,datetime("now"),"S1"};
temps(2,:) = {68,datetime("now")+1,"S2"}temps=4×3 table
Temperature Time Station
___________ ____________________ _________
75 19-Apr-2026 06:47:43 "S1"
68 20-Apr-2026 06:47:43 "S2"
0 NaT <missing>
0 NaT <missing>
As an alternative, you can assign rows from a smaller table into a larger table. With this method, you can assign one or more rows at a time.
temps(3:4,:) = table([63;72],[datetime("now")+2;datetime("now")+3],["S3";"S4"])
temps=4×3 table
    Temperature            Time            Station
    ___________    ____________________    _______

        75         19-Apr-2026 06:47:43     "S1"
        68         20-Apr-2026 06:47:43     "S2"
        63         21-Apr-2026 06:47:43     "S3"
        72         22-Apr-2026 06:47:43     "S4"
You can use either syntax to increase the size of a table by assigning rows beyond the end of the table. If necessary, missing rows are filled in with default values.
temps(6,:) = {62,datetime("now")+6,"S6"}temps=6×3 table
Temperature Time Station
___________ ____________________ _________
75 19-Apr-2026 06:47:43 "S1"
68 20-Apr-2026 06:47:43 "S2"
63 21-Apr-2026 06:47:43 "S3"
72 22-Apr-2026 06:47:43 "S4"
0 NaT <missing>
62 25-Apr-2026 06:47:43 "S6"
Convert Variables to Tables
You can convert variables that have other data types to tables. Cell arrays and structures are other types of containers that can store arrays that have different data types. So, you can convert cell arrays and structures to tables. You can also convert an array to a table where the table variables contain columns of values from the array. To convert these kinds of variables, use the array2table, cell2table, or struct2table functions.
For example, convert an array to a table by using array2table. Arrays do not have column names, so the table has default variable names.
A = randi(3,3)
A = 3×3

     3     3     1
     3     2     2
     1     1     3
a2t = array2table(A)
a2t=3×3 table
    A1    A2    A3
    __    __    __

    3     3     1
    3     2     2
    1     1     3
You can provide your own table variable names by using the VariableNames name-value argument.
a2t = array2table(A,VariableNames=["First" "Second" "Third"])
a2t=3×3 table
    First    Second    Third
    _____    ______    _____

      3        3         1
      3        2         2
      1        1         3
Read Table from File
It is common to have a large quantity of tabular data in a file such as a CSV (comma-separated value) file or an Excel® spreadsheet. To read such data into a table, use the readtable function.
For example, the CSV file outages.csv is a sample file that is distributed with MATLAB. The file contains data for a set of electrical power outages. The first line of outages.csv has column names. The rest of the file has comma-separated data values for each outage. The first few lines are shown here.
Region,OutageTime,Loss,Customers,RestorationTime,Cause
SouthWest,2002-02-01 12:18,458.9772218,1820159.482,2002-02-07 16:50,winter storm
SouthEast,2003-01-23 00:49,530.1399497,212035.3001,,winter storm
SouthEast,2003-02-07 21:15,289.4035493,142938.6282,2003-02-17 08:14,winter storm
West,2004-04-06 05:44,434.8053524,340371.0338,2004-04-06 06:10,equipment fault
MidWest,2002-03-16 06:18,186.4367788,212754.055,2002-03-18 23:23,severe storm
...
To read outages.csv and store the data in a table, you can use readtable. It reads numeric values, dates and times, and strings into table variables that have appropriate data types. Here, Loss and Customers are numeric arrays. The OutageTime and RestorationTime variables are datetime arrays because readtable recognizes the date and time formats of the text in those columns of the input file. To read the rest of the text data into string arrays, specify the TextType name-value argument.
outages = readtable("outages.csv",TextType="string")
outages=1468×6 table
      Region          OutageTime        Loss     Customers     RestorationTime           Cause
    ___________    ________________    ______    __________    ________________    _________________

    "SouthWest"    2002-02-01 12:18    458.98    1.8202e+06    2002-02-07 16:50    "winter storm"
    "SouthEast"    2003-01-23 00:49    530.14    2.1204e+05                 NaT    "winter storm"
    "SouthEast"    2003-02-07 21:15     289.4    1.4294e+05    2003-02-17 08:14    "winter storm"
    "West"         2004-04-06 05:44    434.81    3.4037e+05    2004-04-06 06:10    "equipment fault"
    "MidWest"      2002-03-16 06:18    186.44    2.1275e+05    2002-03-18 23:23    "severe storm"
    "West"         2003-06-18 02:49         0             0    2003-06-18 10:54    "attack"
    "West"         2004-06-20 14:39    231.29           NaN    2004-06-20 19:16    "equipment fault"
    "West"         2002-06-06 19:28    311.86           NaN    2002-06-07 00:51    "equipment fault"
    "NorthEast"    2003-07-16 16:23    239.93         49434    2003-07-17 01:12    "fire"
    "MidWest"      2004-09-27 11:09    286.72         66104    2004-09-27 16:37    "equipment fault"
    "SouthEast"    2004-09-05 17:48    73.387         36073    2004-09-05 20:46    "equipment fault"
    "West"         2004-05-21 21:45    159.99           NaN    2004-05-22 04:23    "equipment fault"
    "SouthEast"    2002-09-01 18:22    95.917         36759    2002-09-01 19:12    "severe storm"
    "SouthEast"    2003-09-27 07:32       NaN    3.5517e+05    2003-10-04 07:02    "severe storm"
    "West"         2003-11-12 06:12    254.09    9.2429e+05    2003-11-17 02:04    "winter storm"
    "NorthEast"    2004-09-18 05:54         0             0                 NaT    "equipment fault"
      ⋮
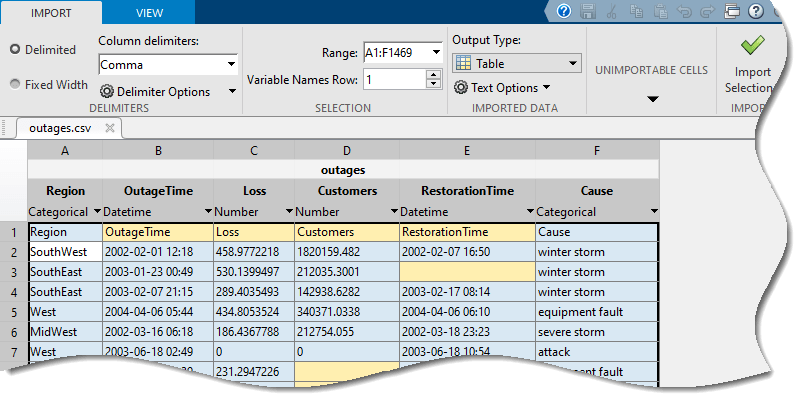
Import Table Using Import Tool
Finally, you can interactively preview and import data from spreadsheets or delimited text files by using the Import Tool. There are two ways to open the Import Tool.
MATLAB Toolstrip: On the Home tab, in the Variable section, click Import Data.
MATLAB command prompt: Enter
uiimport(filename), wherefilenameis the name of a text or spreadsheet file.
For example, open the outages.csv sample file by using uiimport and which to get the path to the file.
uiimport(which("outages.csv"))
The Import Tool shows you a preview of the six columns from outages.csv. To import the data as a table, follow these steps.
In the Imported Variable section, select Table as the type.
Click Import Selection (near the upper-right corner). The new table, named
outages, appears in your workspace.
See Also
Functions
readtable|table|array2table|cell2table|struct2table