grid2image
Display regular data grid as image
Syntax
grid2image(Z,R)

grid2image(Z,R,PropertyName,PropertyValue,...)

h = grid2image(...)
Description
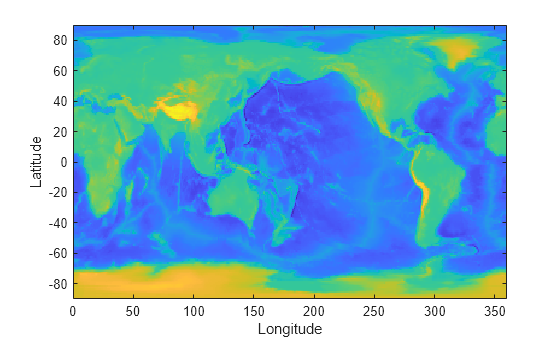
grid2image(Z,R) displays a regular data grid
Z as an image. The image is displayed in unprojected
form, with longitude as x and latitude as y,
producing considerable distortion away from the Equator. Z can
be M-by-N or
M-by-N-by-3, and can contain
double, uint8, or
uint16 data. The grid is georeferenced to
latitude-longitude by R, which is a GeographicCellsReference object. The
RasterSize property of R must be
consistent with Z.
grid2image(Z,R,PropertyName,PropertyValue,...) uses
the specified image properties to display the map. See the image
function reference page for a list of properties that can be changed.
h = grid2image(...) returns the handle
of the image object displayed.
Examples
Load elevation data and a geographic cells reference object for the world.
load topo60cDisplay the data as an image.
figure
grid2image(topo60c,topo60cR)