Main Content

mapoutline

Outline of georeferenced image or data grid

Description

[x,y] = mapoutline(R,sizeA) calculates the xy-coordinates of the rectangle that outlines the specified map raster reference object. The sizeA argument specifies the size of the image or data grid that is associated with the reference object.

example

[x,y] = mapoutline(R,h,w) specifies the height and width of the image or data grid, such that [h w] = [sizeA(1) sizeA(2)].

[x,y] = mapoutline(___,"close") closes the rectangle by appending the first elements of x and y to the ends of x and y.

example

mat = mapoutline(___) returns the xy-coordinates of the rectangle, such that mat = [x y].

Examples

collapse all

Read a GeoTIFF image of Boston as an array and a map cells reference object.

[A,R] = readgeoraster("boston.tif");

Calculate the xy-coordinates of the rectangle that outlines the image. Close the rectangle by specifying the "close" option.

sizeA = R.RasterSize;
[x,y] = mapoutline(R,sizeA,"close")
x = 5×1
105 ×

    7.6432
    7.6432
    7.7902
    7.7902
    7.6432

y = 5×1
106 ×

    2.9606
    2.9511
    2.9511
    2.9606
    2.9606

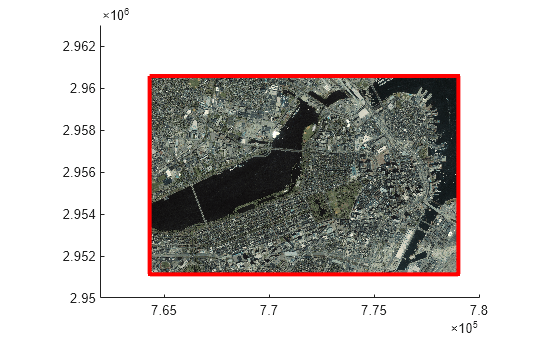
Display the image and the outline by using the mapshow function. Use a thick, red line for the outline. Improve the visibility of the outline by zooming out.

figure
mapshow(A,R,DisplayType="image")
mapshow(x,y,DisplayType="line",Color="r",LineWidth=3)

xlim([762000 780000])
ylim([2950000 2963000])

Figure contains an axes object. The axes object contains 2 objects of type image, line.

Input Arguments

collapse all

Raster reference, specified as a MapCellsReference object or a MapPostingsReference object.

Size of the image or data grid that is associated with R, specified as a two-element vector of the form [h w], where h is the height and w is the width. You can find this value by querying the RasterSize property of R.

Data Types: double

Height of the image or data grid that is associated with R, specified as a numeric scalar.

Data Types: double

Width of the image or data grid that is associated with R, specified as a numeric scalar.

Data Types: double

Output Arguments

collapse all

x-coordinates of the rectangle that outlines R, returned as one of these values:

  • A four-element column vector, when you do not specify the "close" option.

  • A five-element column vector, when you specify the "close" option. The first and last elements of the vector are equal.

y-coordinates of the rectangle that outlines R, returned as one of these values:

  • A four-element column vector, when you do not specify the "close" option.

  • A five-element column vector, when you specify the "close" option. The first and last elements of the vector are equal.

xy-coordinates of the rectangle that outlines R, returned as one of these values:

  • A 4-by-2 matrix, when you do not specify the "close" option.

  • A 5-by-2 matrix, when you specify the "close" option. The first and last rows of the matrix are equal.

Alternative Functionality

Create an area of interest (AOI) from a MapCellsReference or MapPostingsReference object by using the aoiquad function. An AOI is a mappolyshape or geopolyshape object that defines a focus area for geospatial analysis and visualization. For more information about AOIs, see Define Areas of Interest.

Version History

Introduced before R2006a

expand all