Add Graph Node Names, Edge Weights, and Other Attributes
This example shows how to add attributes to the nodes and edges in graphs created using graph and digraph. You can specify node names or edge weights when you originally call graph or digraph to create a graph. However, this example shows how to add attributes to a graph after it has been created.
Create Graph
Create a directed graph. The corresponding elements in s and t define the source and target nodes of each edge in the graph.
s = [1 1 2 2 3];
t = [2 4 3 4 4];
G = digraph(s,t)
G =
  digraph with properties:

    Edges: [5×1 table]
    Nodes: [4×0 table]
Add Node Names
Add node names to the graph by adding the variable, Name, to the G.Nodes table. The Name variable must be specified as an N-by-1 cell array of character vectors or string array, where N = numnodes(G). It is important to use the Name variable when adding node names, as this variable name is treated specially by some graph functions.
G.Nodes.Name = {'First' 'Second' 'Third' 'Fourth'}';View the new Nodes table.
G.Nodes
ans=4×1 table
       Name
    __________

    {'First' }
    {'Second'}
    {'Third' }
    {'Fourth'}
Use table indexing to view the names of nodes 1 and 4.
G.Nodes.Name([1 4])
ans = 2×1 cell
    {'First' }
    {'Fourth'}
Add Edge Weights
Add edge weights to the graph by adding the variable, Weight, to the G.Edges table. The Weight variable must be an M-by-1 numeric vector, where M = numedges(G). It is important to use the Weight variable when adding edge weights, as this variable name is treated specially by some graph functions.
G.Edges.Weight = [10 20 30 40 50]';
View the new Edges table.
G.Edges
ans=5×2 table
            EndNodes            Weight
    ________________________    ______

    {'First' }    {'Second'}      10
    {'First' }    {'Fourth'}      20
    {'Second'}    {'Third' }      30
    {'Second'}    {'Fourth'}      40
    {'Third' }    {'Fourth'}      50
Use table indexing to view the first and third rows of G.Edges.
G.Edges([1 3],:)
ans=2×2 table
            EndNodes            Weight
    ________________________    ______

    {'First' }    {'Second'}      10
    {'Second'}    {'Third' }      30
Add Custom Attributes
In principle you can add any variable to G.Nodes and G.Edges that defines an attribute of the graph nodes or edges. Adding custom attributes can be useful, since functions like subgraph and reordernodes preserve the graph attributes.
For example, add a variable named Power to G.Edges to indicate whether each edge is 'on' or 'off'.
G.Edges.Power = {'on' 'on' 'on' 'off' 'off'}';
G.Edgesans=5×3 table
EndNodes Weight Power
________________________ ______ _______
{'First' } {'Second'} 10 {'on' }
{'First' } {'Fourth'} 20 {'on' }
{'Second'} {'Third' } 30 {'on' }
{'Second'} {'Fourth'} 40 {'off'}
{'Third' } {'Fourth'} 50 {'off'}
Add a variable named Size to G.Nodes to indicate the physical size of each node.
G.Nodes.Size = [10 20 10 30]';
G.Nodes
ans=4×2 table
       Name       Size
    __________    ____

    {'First' }     10
    {'Second'}     20
    {'Third' }     10
    {'Fourth'}     30
Modify Tables with Variables Editor
Since Nodes and Edges are both tables, you can use the Variables editor to interactively view or edit the tables. For more information, see Create and Edit Variables.
Label Nodes and Edges of Graph Plot
When you plot a graph, you can use the variables in G.Nodes and G.Edges to label the graph nodes and edges. This practice is convenient, since these variables are already guaranteed to have the correct number of elements.
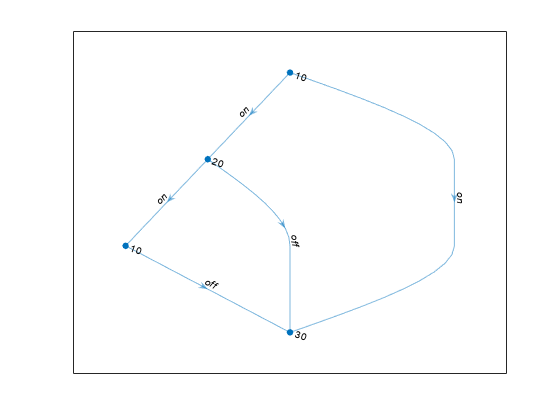
Plot the graph and label the edges using the Power variable in G.Edges. Label the nodes using the Size variable in G.Nodes.
p = plot(G,'EdgeLabel',G.Edges.Power,'NodeLabel',G.Nodes.Size)
p =
  GraphPlot with properties:

     NodeColor: [0.0660 0.4430 0.7450]
    MarkerSize: 4
        Marker: 'o'
     EdgeColor: [0.0660 0.4430 0.7450]
     LineWidth: 0.5000
     LineStyle: '-'
     NodeLabel: {'10'  '20'  '10'  '30'}
     EdgeLabel: {'on'  'on'  'on'  'off'  'off'}
         XData: [2 1.5000 1 2]
         YData: [4 3 2 1]
         ZData: [0 0 0 0]

  Show all properties