Delaunay Triangulation of 2-D Points
Create, query, and edit a Delaunay triangulation from the seamount data using delaunayTriangulation. The seamount data set contains (x, y) locations and corresponding elevations (z) that define the surface of the seamount.
Load and triangulate the (x, y) data.
load seamount
DT = delaunayTriangulation(x,y)
DT =
delaunayTriangulation with properties:
Points: [294×2 double]
ConnectivityList: [566×3 double]
Constraints: []
The Constraints property is empty because there aren't any imposed edge constraints. The Points property represents the coordinates of the vertices, and the ConnectivityList property represents the triangles. Together, these two properties define the matrix data for the triangulation.
The delaunayTriangulation class is a wrapper around the matrix data, and it offers a set of complementary methods. You access the properties in a delaunayTriangulation in the same way you access the fields of a struct.
Access the vertex data.
DT.Points;
Access the connectivity data.
DT.ConnectivityList;
Access the first triangle in the ConnectivityList property.
DT.ConnectivityList(1,:)
ans = 1×3

   230   205   152
delaunayTriangulation provides an easy way to index into the ConnectivityList property matrix.
Access the first triangle.
DT(1,:)
ans = 1×3

   230   205   152
Examine the first vertex of the first triangle.
DT(1,1)
ans =
230
Examine all the triangles in the triangulation.
DT(:,:);
Indexing into the delaunayTriangulation output, DT, works like indexing into the triangulation array output from delaunay. The difference between the two are the extra methods that you can call on DT (for example, nearestNeighbor and pointLocation).
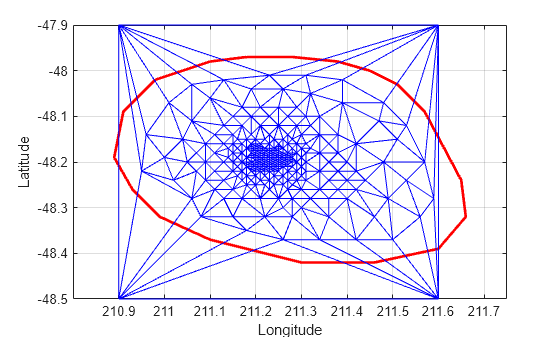
Use triplot to plot the delaunayTriangulation. The triplot function is not a delaunayTriangulation method, but it accepts and can plot a delaunayTriangulation.
triplot(DT)
axis equal
xlabel("Longitude")
ylabel("Latitude")
grid on
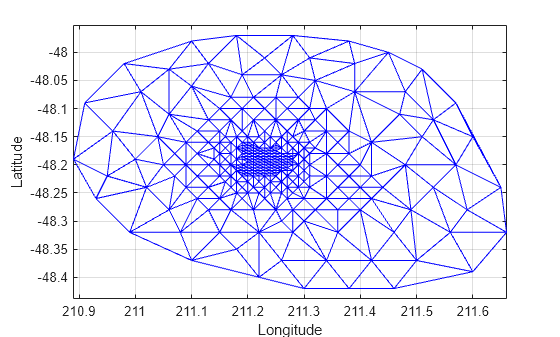
Alternatively, you could use triplot(DT(:,:), DT.Points(:,1), DT.Points(:,2)); to get the same plot.
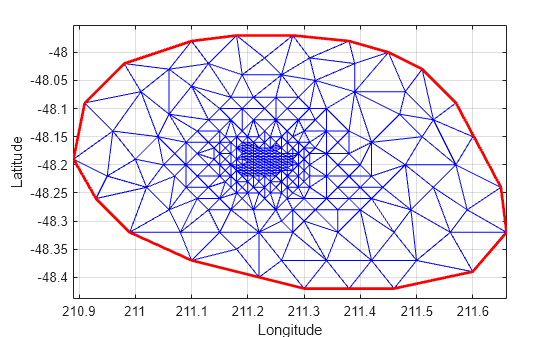
Use the delaunayTriangulation method, convexHull, to compute the convex hull and add it to the plot. Since you already have a Delaunay triangulation, this method allows you to derive the convex hull more efficiently than a full computation using convhull.
hold on
k = convexHull(DT);
xHull = DT.Points(k,1);
yHull = DT.Points(k,2);
plot(xHull,yHull,"r",LineWidth=2)
hold off
You can incrementally edit the delaunayTriangulation to add or remove points. If you need to add points to an existing triangulation, then an incremental addition is faster than a complete retriangulation of the augmented point set. Incremental removal of points is more efficient when the number of points to be removed is small relative to the existing number of points.
Edit the triangulation to remove the points on the convex hull from the previous computation.
figure
plot(xHull,yHull,"r",LineWidth=2)
axis equal
xlabel("Longitude")
ylabel("Latitude")
grid on
The convex hull topology duplicates the start and end vertex. Remove the duplicate entry.
k(end) = [];
Now remove the points on the convex hull.
DT.Points(k,:) = []
DT =
  delaunayTriangulation with properties:

              Points: [274×2 double]
    ConnectivityList: [528×3 double]
         Constraints: []
Plot the new triangulation.
hold on
triplot(DT)
hold off
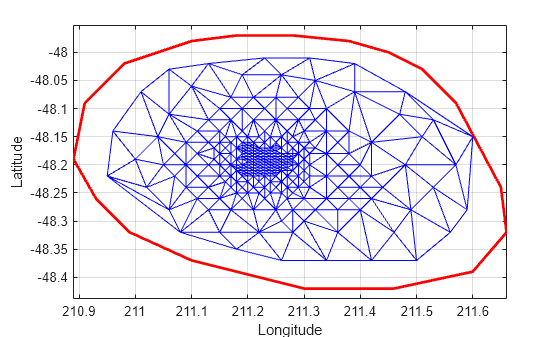
There is one vertex that is just inside the boundary of the convex hull that was not removed. The fact that it is interior to the hull can be seen using the Zoom-In tool in the figure. You could plot the vertex labels to determine the index of this vertex and remove it from the triangulation. Alternatively, you can use the nearestNeighbor method to identify the index more readily.
The point is close to location (211.6, -48.15). Use the nearestNeighbor method to find the nearest vertex.
vertexId = nearestNeighbor(DT,211.6,-48.15)
vertexId =
50
Now remove that vertex from the triangulation.
DT.Points(vertexId,:) = []
DT =
  delaunayTriangulation with properties:

              Points: [273×2 double]
    ConnectivityList: [525×3 double]
         Constraints: []
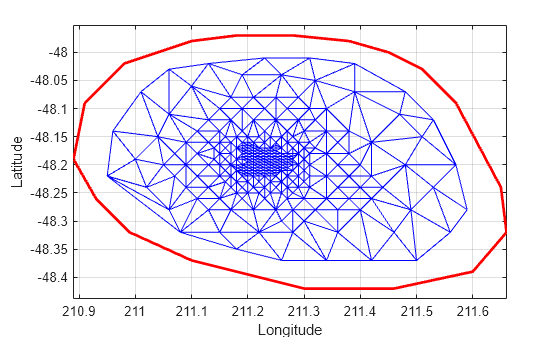
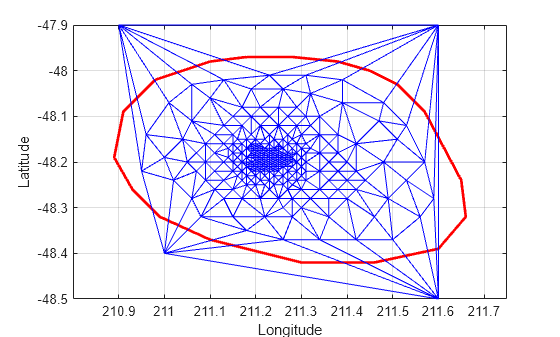
Plot the new triangulation.
figure
plot(xHull,yHull,"r",LineWidth=2)
axis equal
xlabel("Longitude")
ylabel("Latitude")
grid on
hold on
triplot(DT)
hold off
Add points to the existing triangulation. Add 4 points to form a rectangle around the triangulation.
Padditional = [210.9 -48.5; 211.6 -48.5; ...
     211.6 -47.9; 210.9 -47.9];
DT.Points(end+(1:4),:) = Padditional
DT =
delaunayTriangulation with properties:
Points: [277×2 double]
ConnectivityList: [548×3 double]
Constraints: []
Close all existing figures.
close allPlot the new triangulation.
figure
plot(xHull,yHull,"r",LineWidth=2)
axis equal
xlabel("Longitude")
ylabel("Latitude")
grid on
hold on
triplot(DT)
hold off
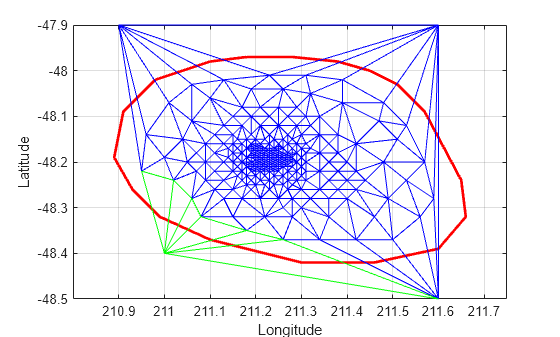
You can edit the points in the triangulation to move them to a new location. Edit the first of the additional point set (the vertex ID 274).
DT.Points(274,:) = [211 -48.4];
Close all existing figures.
close allPlot the new triangulation
figure
plot(xHull,yHull,"r",LineWidth=2)
axis equal
xlabel("Longitude")
ylabel("Latitude")
grid on
hold on
triplot(DT)
hold off
Use the a method of the triangulation class, vertexAttachments, to find the attached triangles. Since the number of triangles attached to a vertex is variable, the method returns the attached triangle IDs in a cell array. You need braces to extract the contents.
attTris = vertexAttachments(DT,274);
hold on
triplot(DT(attTris{:},:),DT.Points(:,1),DT.Points(:,2),"g")
hold off
delaunayTriangulation also can be used to triangulate points in 3-D space. The resulting triangulation is composed of tetrahedra.