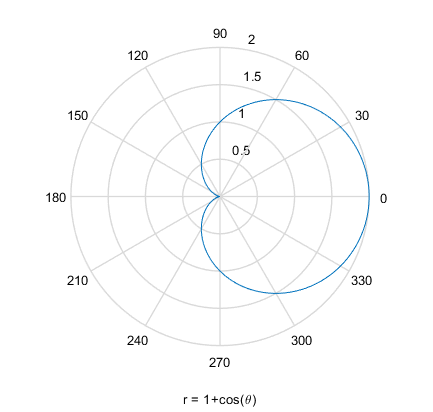
ezpolar
(Not recommended) Easy-to-use polar coordinate plotter
ezpolar is not recommended. Use fpolarplot
instead. (since R2024a) For more information on updating your code, see Version History.
Description
ezpolar( plots the curve defined by the
function f)rho = f(theta) over the default interval [0,
2π] for theta.
ezpolar automatically adds a title to the bottom of the
plot.
ezpolar(
plots over the specified interval. Specify the interval as a two-element vector of the form
f,thetainterval)[thetamin thetamax].
ezpolar( plots into the
axes specified by ax,___)ax. Specify the axes as the first input argument in
any of the previous syntaxes.
h = ezpolar(___) returns a Line
object. Use h to modify properties of the plot after creating it. For a
list of properties, see Line Properties.
