layout
Change layout of graph plot
Description
layout( changes the layout of graph
plot H)H by using an automatic choice of layout method based on the
structure of the graph. The layout function modifies the
XData and YData properties of
H.
layout(
uses additional options specified by one or more name-value pair arguments. For
example, H,method,Name,Value)layout(H,'force','Iterations',N) specifies the number of
iterations to use in computing the force layout, and
layout(H,'layered','Sources',S) uses a layered layout with
source nodes S included in the first layer.
Examples
Create and plot a graph using the 'force' layout.
s = [1 1 1 1 1 6 6 6 6 6];
t = [2 3 4 5 6 7 8 9 10 11];
G = graph(s,t);
h = plot(G,'Layout','force');
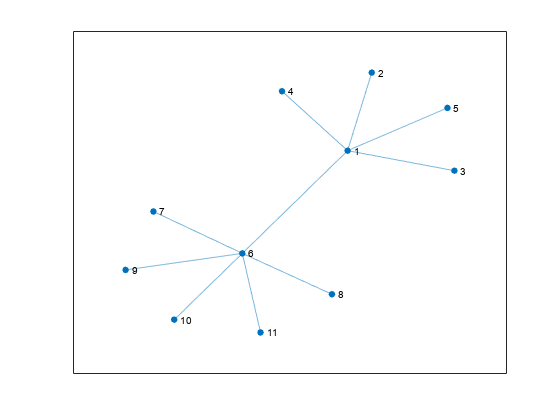
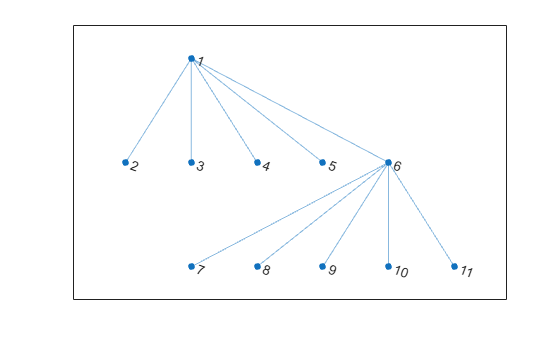
Change the layout to be the default that plot determines based on the structure and properties of the graph. The result is the same as using plot(G).
layout(h)
Create and plot a graph using the 'layered' layout.
s = [1 1 1 2 2 3 3 4 5 5 6 7];
t = [2 4 5 3 6 4 7 8 6 8 7 8];
G = graph(s,t);
h = plot(G,'Layout','layered');
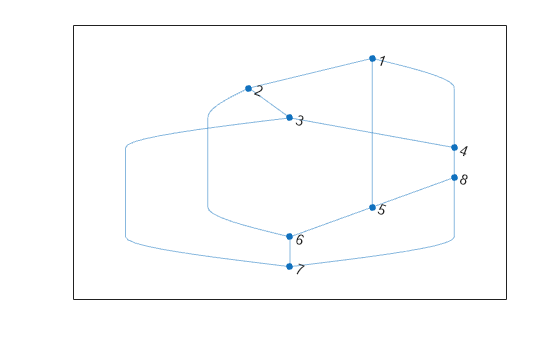
Change the layout of the graph to use the 'subspace' method.
layout(h,'subspace')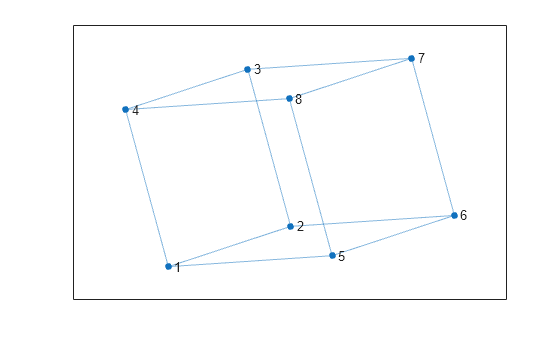
Create and plot a graph using the 'layered' layout method.
s = [1 1 1 2 3 3 3 4 4];
t = [2 4 5 6 2 4 7 8 1];
G = digraph(s,t);
h = plot(G,'Layout','layered');
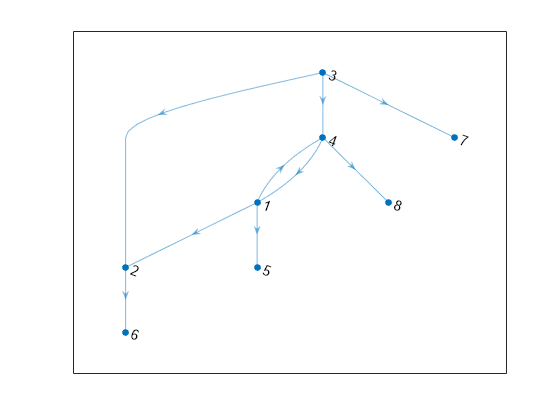
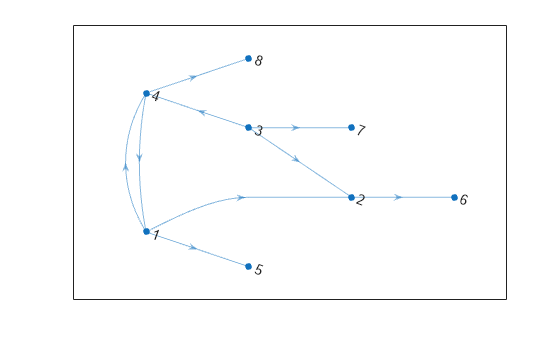
Use the layout function to refine the hierarchical layout by specifying source nodes and a horizontal orientation.
layout(h,'layered','Direction','right','Sources',[1 4])
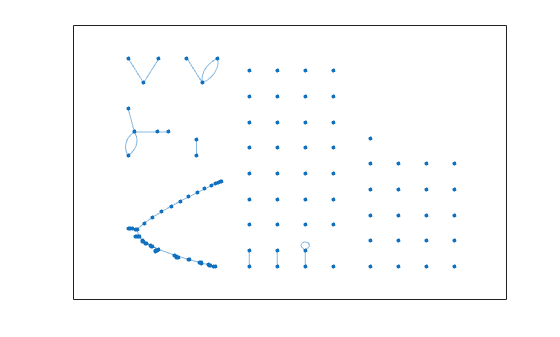
Plot a graph that has multiple components, and then show how to use the 'UseGravity' option to improve the visualization.
Create and plot a graph that has 150 nodes separated into many disconnected components. MATLAB® lays the graph components out on a grid.
s = [1 3 5 7 7 10:100];
t = [2 4 6 8 9 randi([10 100],1,91)];
G = graph(s,t,[],150);
h = plot(G);
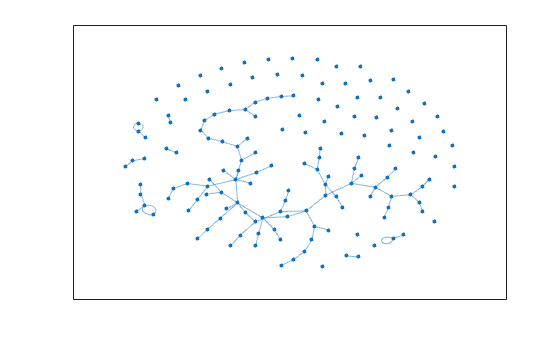
Update the layout coordinates of the graph object, and specify 'UseGravity' as true so that the components are laid out radially around the origin, with more space allotted for the larger components.
layout(h,'force','UseGravity',true)
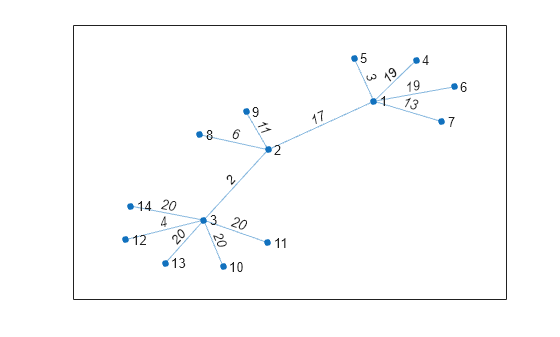
Plot a graph using the 'WeightEffect' name-value pair to make the length of graph edges proportional to their weights.
Create and plot a directed graph with weighted edges.
s = [1 1 1 1 1 2 2 2 3 3 3 3 3];
t = [2 4 5 6 7 3 8 9 10 11 12 13 14];
weights = randi([1 20],1,13);
G = graph(s,t,weights);
p = plot(G,'Layout','force','EdgeLabel',G.Edges.Weight);
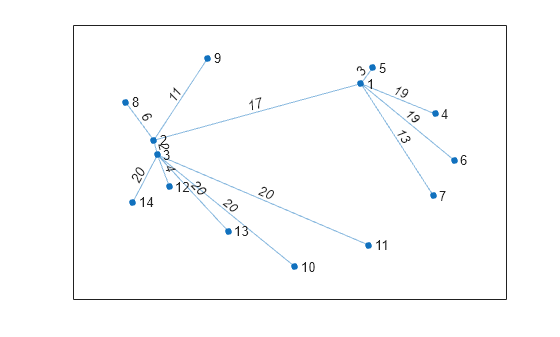
Recompute the layout of the graph using the 'WeightEffect' name-value pair, so that the length of each edge is proportional to its weight. This makes it so that the edges with the largest weights are the longest.
layout(p,'force','WeightEffect','direct')
Input Arguments
Name-Value Arguments
Tips
Use the
Layoutname-value pair to change the layout of a graph when you plot it. For example,plot(G,'Layout','circle')plots the graphGwith a circular layout.When using the
'force'or'force3'layout methods, a best practice is to use more iterations with the algorithm instead of usingXStart,YStart, andZStartto restart the algorithm using previous outputs. The result of executing the algorithm with 100 iterations is different in comparison to executing 50 iterations, and then restarting the algorithm from the ending positions to execute 50 more iterations.
References
[1] Fruchterman, T., and E. Reingold,. “Graph Drawing by Force-directed Placement.” Software — Practice & Experience. Vol. 21 (11), 1991, pp. 1129–1164.
[2] Gansner, E., E. Koutsofios, S. North, and K.-P Vo. “A Technique for Drawing Directed Graphs.” IEEE Transactions on Software Engineering. Vol.19, 1993, pp. 214–230.
[3] Barth, W., M. Juenger, and P. Mutzel. “Simple and Efficient Bilayer Cross Counting.” Journal of Graph Algorithms and Applications. Vol.8 (2), 2004, pp. 179–194.
[4] Brandes, U., and B. Koepf. “Fast and Simple Horizontal Coordinate Assignment.” LNCS. Vol. 2265, 2002, pp. 31–44.
[5] Y. Koren. “Drawing Graphs by Eigenvectors: Theory and Practice.” Computers and Mathematics with Applications. Vol. 49, 2005, pp. 1867–1888.
Version History
Introduced in R2015b