nexttile
Create axes in tiled chart layout
Syntax
Description
nexttile creates an axes object and places it into the next empty
tile of the tiled chart layout that is in the current figure. If there is no layout in the
current figure, then nexttile creates a new layout and configures it
using the 'flow' tile arrangement. The resulting axes object is the
current axes, so the next plotting command can plot into it.
nexttile( creates an axes object that
spans across multiple rows or columns of the grid in the center of the layout. Specify
span)span as a vector of the form [r c]. The axes spans
r rows by c columns of tiles. The upper left corner
of the axes is positioned in the upper left corner of the first empty
r-by-c region in the grid.
nexttile( assigns the current
axes to be the axes or standalone visualization in the tile specified by
tilelocation)tilelocation. Typically, this syntax is useful when you want to modify
an existing axes or standalone visualization. However, in some cases,
nexttile creates a new axes object:
When the specified tile is empty,
nexttilecreates an axes object in that tile.When the specified tile contains part of an axes or standalone visualization object, but not its upper left corner,
nexttilereplaces the existing object. For example, iftilelocationrefers to a tile in the middle of an axes object that spans multiple tiles,nexttilereplaces the existing axes object with a new one in the tile you specify.
nexttile(
creates an axes object that spans across multiple rows or columns, starting at the tile
specified by tilelocation,span)tilelocation. If the tile you specify is occupied by an axes
or standalone visualization, nexttile either makes that object the
current axes or replaces it:
If the existing axes or standalone visualization object spans across the same set of tiles as the
tilelocationandspanarguments specify, thennexttilemakes that object the current axes.If the existing axes or standalone visualization object spans across a different set of tiles than the
tilelocationandspanarguments specify, thennexttilereplaces the existing object with a new axes object using the newtilelocationandspanvalues.
nexttile( operates on the
tiled chart layout specified by t,___)t. Specify t before
all other input arguments. This syntax is useful when you are working with multiple layouts,
or when the layout is in a panel or tab instead of a figure.
ax = nexttile(___) returns the axes object. Use
ax to set properties on the axes. You can also pass
ax as an input argument to other graphics functions that operate on an
axes object. For example, you can call the colormap or
colororder function to change the color scheme for the axes.
Examples
If a tiled chart layout does not already exist, nexttile creates one.
Create four coordinate vectors: x, y1, y2, and y3.
Call the nexttile function to create a tiled chart layout and an axes object in the first tile. Then plot y1 in the first tile. This first plot fills the entire layout because nexttile creates the layout using the 'flow' tile arrangement.
x = linspace(0,30);
y1 = sin(x/2);
y2 = sin(x/3);
y3 = sin(x/4);

% Create layout and first plot
nexttile
plot(x,y1)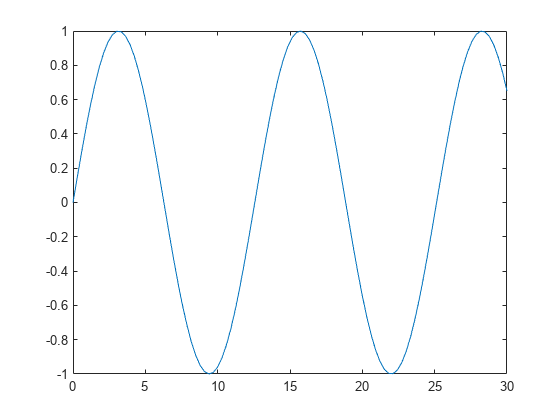
Create a second tile and axes, and plot into the axes.
nexttile
plot(x,y2)
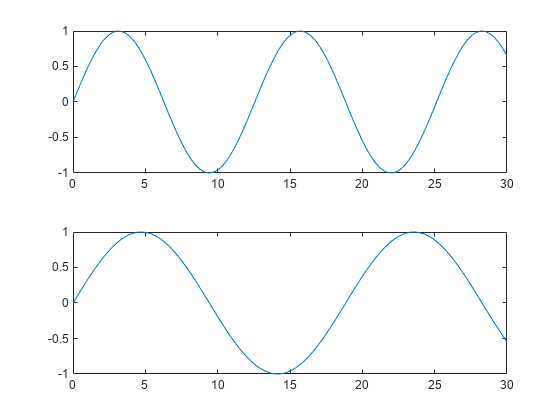
Repeat the process to create a third plot.
nexttile
plot(x,y3)
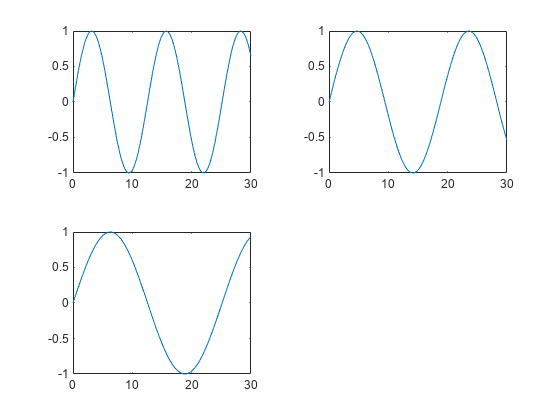
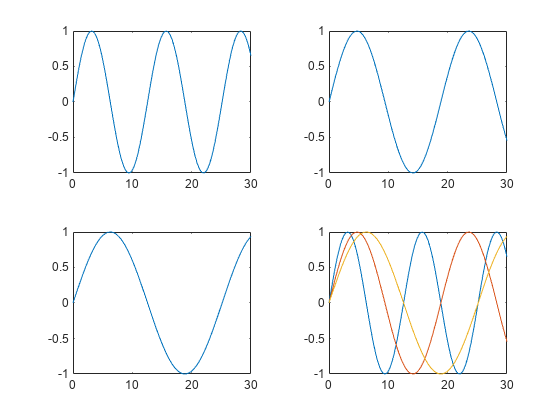
Repeat the process to create a fourth plot. This time, plot all three lines in the same axes by calling hold on after plotting y1.
nexttile
plot(x,y1)
hold on
plot(x,y2)
plot(x,y3)
hold off
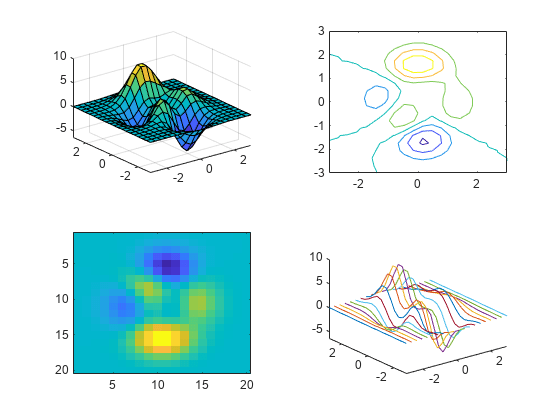
Call the tiledlayout function to create a 2-by-2 tiled chart layout, and call the peaks function to get the coordinates of a predefined surface. Create an axes object in the first tile by calling the nexttile function. Then call the surf function to plot into the axes. Repeat the process using different plotting functions for the other three tiles.
tiledlayout(2,2);
[X,Y,Z] = peaks(20);

% Tile 1
nexttile
surf(X,Y,Z)

% Tile 2
nexttile
contour(X,Y,Z)

% Tile 3
nexttile
imagesc(Z)

% Tile 4
nexttile
plot3(X,Y,Z)
Create a tiled chart layout that has a vertical stack of plots by specifying the "vertical" option when you call the tiledlayout function. Then create three plots by calling the nexttile function followed by a plotting function. Each time you call nexttile, a new axes object is added to the bottom of the stack.
tiledlayout("vertical")
x = 0:0.1:5;
nexttile
plot(x,sin(x))
nexttile
plot(x,sin(x+1))
nexttile
plot(x,sin(x+2))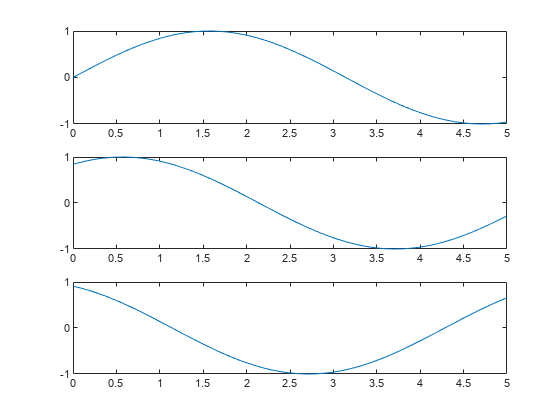
Create a tiled chart layout that has a horizontal stack of plots by specifying the "horizontal" option when you call the tiledlayout function. Then create three plots by calling the nexttile function followed by a plotting function. Each time you call nexttile, a new axes object is added to the right side of the stack.
tiledlayout("horizontal")
x = 0:0.1:10;
nexttile
plot(x,sin(x/2))
nexttile
plot(x,sin(x))
nexttile
plot(x,sin(2*x))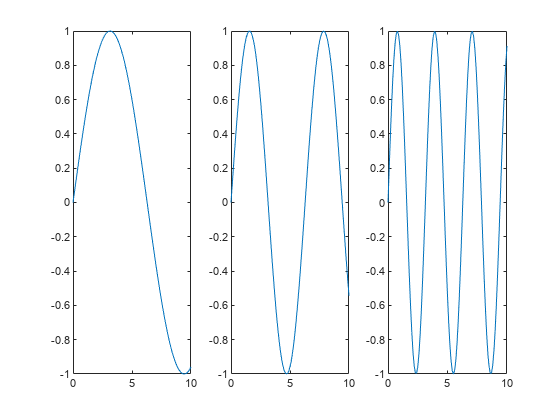
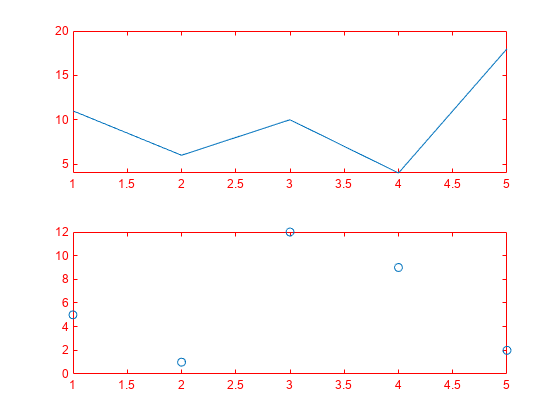
Call the tiledlayout function to create a 2-by-1 tiled chart layout. Call the nexttile function with an output argument to store the axes. Then plot into the axes, and set the x- and y-axis colors to red. Repeat the process in the second tile.
t = tiledlayout(2,1);

% First tile
ax1 = nexttile;
plot([1 2 3 4 5],[11 6 10 4 18]);
ax1.XColor = [1 0 0];
ax1.YColor = [1 0 0];

% Second tile
ax2 = nexttile;
plot([1 2 3 4 5],[5 1 12 9 2],'o');
ax2.XColor = [1 0 0];
ax2.YColor = [1 0 0];
Define scores and strikes as vectors containing bowling league data over four games. Then create a tiled chart layout and display three plots showing the number of strikes for each team.
scores = [444 460 380
          387 366 500
          365 451 611
          548 412 452];

strikes = [9  6  5
           6  4  8
           4  7  16
           10 9  8];

t = tiledlayout('flow');

% Team 1
nexttile
plot([1 2 3 4],strikes(:,1),'-o')
title('Team 1 Strikes')

% Team 2
nexttile
plot([1 2 3 4],strikes(:,2),'-o')
title('Team 2 Strikes')

% Team 3
nexttile
plot([1 2 3 4],strikes(:,3),'-o')
title('Team 3 Strikes')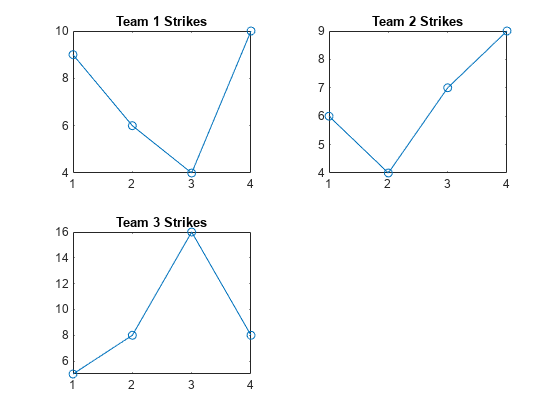
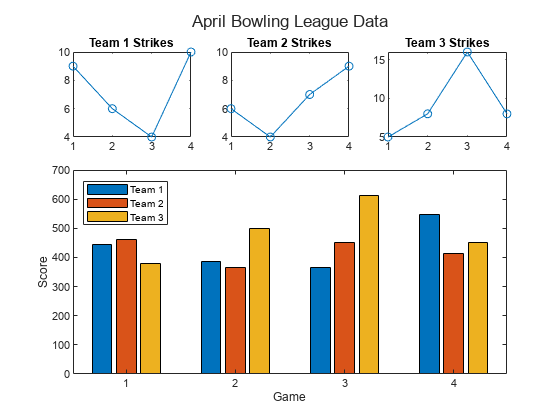
Call the nexttile function to create an axes object that spans two rows by three columns. Then display a bar graph in the axes with a legend, and configure the axis tick values and labels. Call the title function to add a tile to the layout.
nexttile([2 3]);
bar([1 2 3 4],scores)
legend('Team 1','Team 2','Team 3','Location','northwest')

% Configure ticks and axis labels
xticks([1 2 3 4])
xlabel('Game')
ylabel('Score')

% Add layout title
title(t,'April Bowling League Data')
To span an axes object from a specific location, specify the tile number and the span value.
Define scores and strikes as vectors containing bowling league data over four games. Then create a 3-by-3 tiled chart layout and display five bar graphs showing the number of strikes for each team.
scores = [444 460 380 388 389
          387 366 500 467 460
          365 451 611 426 495
          548 412 452 471 402];

strikes = [9  6  5  7  5
           6  4  8 10  7
           4  7 16  9  9
           10  9  8  8  9];

t = tiledlayout(3,3);

% Team 1
nexttile
bar([1 2 3 4],strikes(:,1))
title('Team 1 Strikes')

% Team 2
nexttile
bar([1 2 3 4],strikes(:,2))
title('Team 2 Strikes')

% Team 3
nexttile
bar([1 2 3 4],strikes(:,3))
title('Team 3 Strikes')

% Team 4
nexttile
bar([1 2 3 4],strikes(:,4))
title('Team 4 Strikes')

% Team 5
nexttile(7)
bar([1 2 3 4],strikes(:,5))
title('Team 5 Strikes')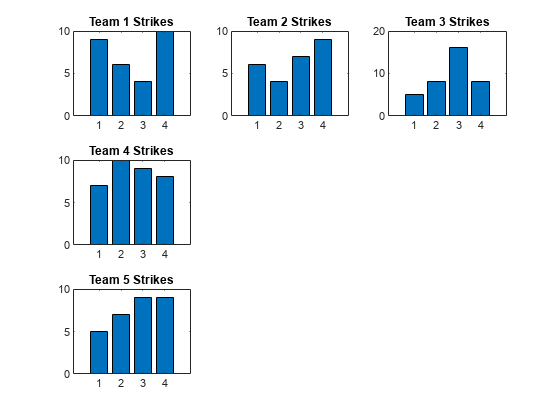
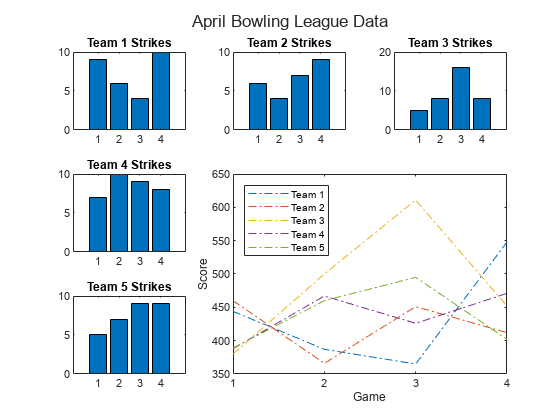
Display a larger plot with a legend. Call the nexttile function to place the upper left corner of the axes in the fifth tile, and span the axes across two rows by two columns of tiles. Plot the scores for all the teams. Configure the x-axis to display four ticks, and add labels to each axis. Then add a shared title at the top of the layout.
nexttile(5,[2 2]);
plot([1 2 3 4],scores,'-.')
labels = {'Team 1','Team 2','Team 3','Team 4','Team 5'};
legend(labels,'Location','northwest')

% Configure ticks and axis labels
xticks([1 2 3 4])
xlabel('Game')
ylabel('Score')

% Add layout title
title(t,'April Bowling League Data')
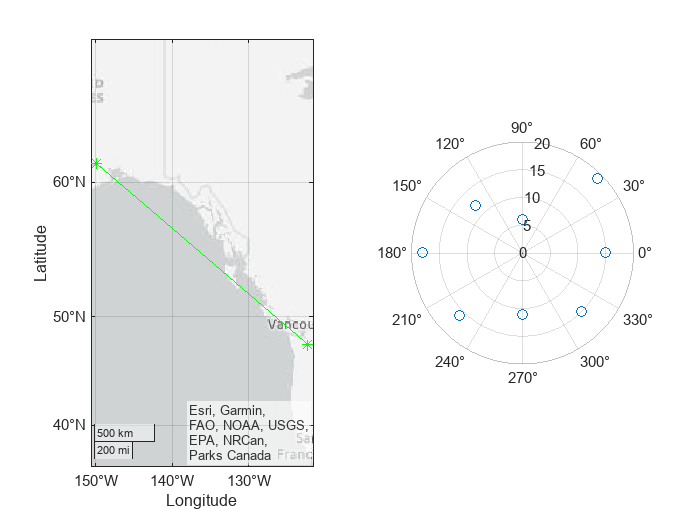
Create a 1-by-2 tiled chart layout. In the first tile, display a geographic plot containing a line that connects two cities on a map. In the second tile, create a scatter plot in polar coordinates.
tiledlayout(1,2)

% Display geographic plot
nexttile
geoplot([47.62 61.20],[-122.33 -149.90],'g-*')

% Display polar plot
nexttile
theta = pi/4:pi/4:2*pi;
rho = [19 6 12 18 16 11 15 15];
polarscatter(theta,rho)
One of the ways that the nexttile output argument is useful is when you want to adjust the content in a previous tile. For example, you might decide to reconfigure the colormap used in a previous plot.
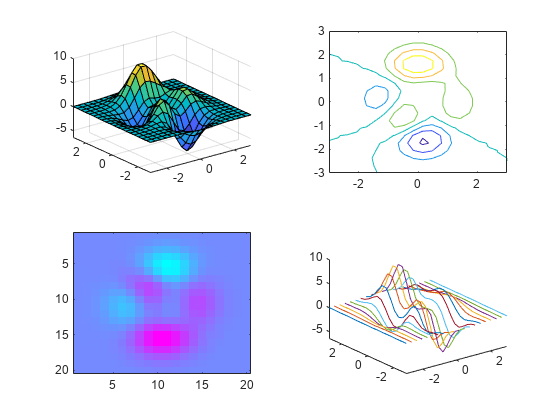
Create a 2-by-2 tiled chart layout. Call the peaks function to get the coordinates for a predefined surface. Then create a different plot of the surface in each tile.
tiledlayout(2,2);
[X,Y,Z] = peaks(20);

% Tile 1
nexttile
surf(X,Y,Z)

% Tile 2
nexttile
contour(X,Y,Z)

% Tile 3
nexttile
imagesc(Z)

% Tile 4
nexttile
plot3(X,Y,Z)

To change the colormap in the third tile, get the axes in that tile. Call the nexttile function by specifying the tile number, and return the axes output argument. Then pass the axes to the colormap function.
ax = nexttile(3);
colormap(ax,cool)
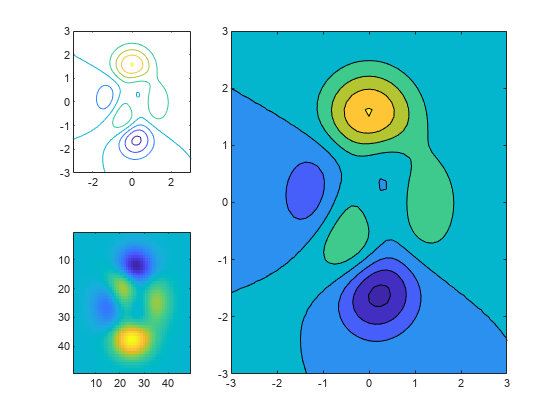
Create a 2-by-3 tiled chart layout containing two plots in individual tiles, and one plot that spans across two rows and two columns.
t = tiledlayout(2,3);
[X,Y,Z] = peaks;

% Tile 1
nexttile
contour(X,Y,Z)

% Span across two rows and columns
nexttile([2 2])
contourf(X,Y,Z)

% Last tile
nexttile
imagesc(Z)
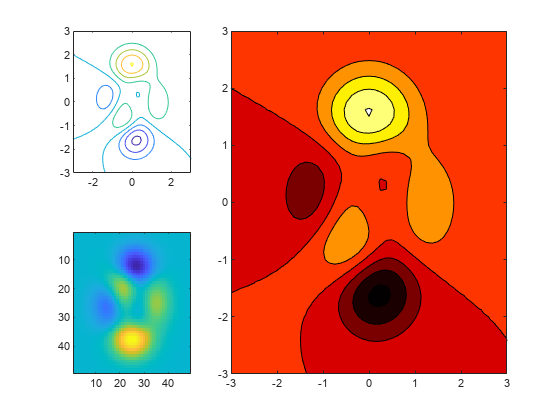
To change the colormap for the spanned axes, identify the tile location as one containing the upper-left corner of the axes. In this case, the upper-left corner is in the second tile. Call the nexttile function with 2 as tile location, and specify an output argument to return the axes object at that location. Then pass the axes to the colormap function.
ax = nexttile(2);
colormap(ax,hot)
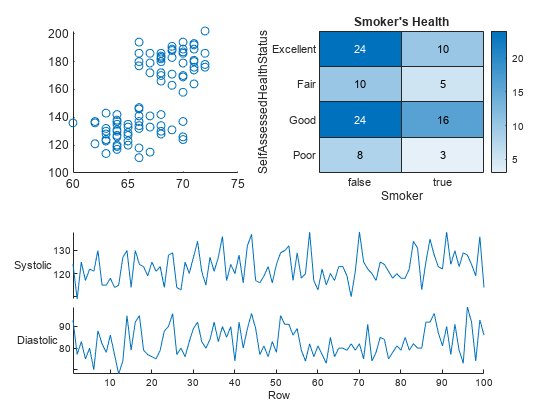
Load the patients data set and create a table from a subset of the variables. Then create a 2-by-2 tiled chart layout. Display a scatter plot in the first tile, a heatmap in the second tile, and a stacked plot across the bottom two tiles.
load patients
tbl = table(Diastolic,Smoker,Systolic,Height,Weight,SelfAssessedHealthStatus);
tiledlayout(2,2)

% Scatter plot
nexttile
scatter(tbl.Height,tbl.Weight)

% Heatmap
nexttile
heatmap(tbl,'Smoker','SelfAssessedHealthStatus','Title','Smoker''s Health');

% Stacked plot
nexttile([1 2])
stackedplot(tbl,{'Systolic','Diastolic'});
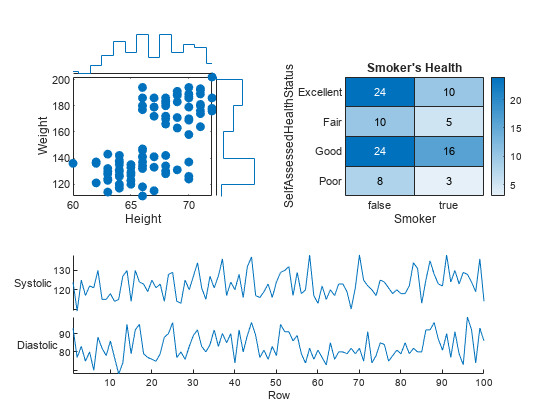
Call nexttile, and specify the tile number as 1 to make the axes in that tile the current axes. Replace the contents of that tile with a scatter histogram.
nexttile(1)
scatterhistogram(tbl,'Height','Weight');
When you want to share a colorbar or legend between two or more plots, you can place it in a separate tile.
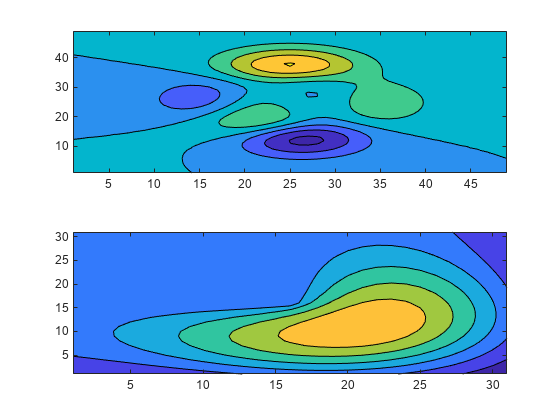
Create filled contour plots of the peaks and membrane data sets in a tiled chart layout.
Z1 = peaks;
Z2 = membrane;
tiledlayout(2,1);
nexttile
contourf(Z1)
nexttile
contourf(Z2)
Add a colorbar, and move it to the east tile.
cb = colorbar;
cb.Layout.Tile = 'east';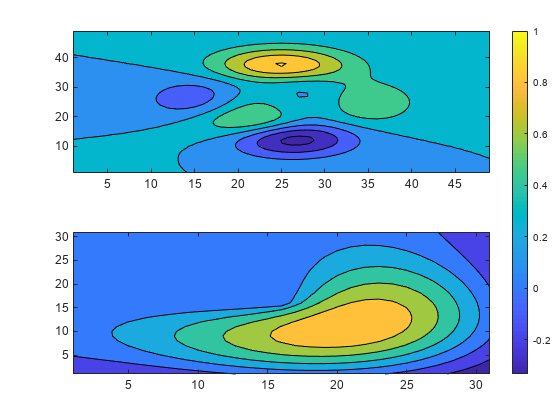
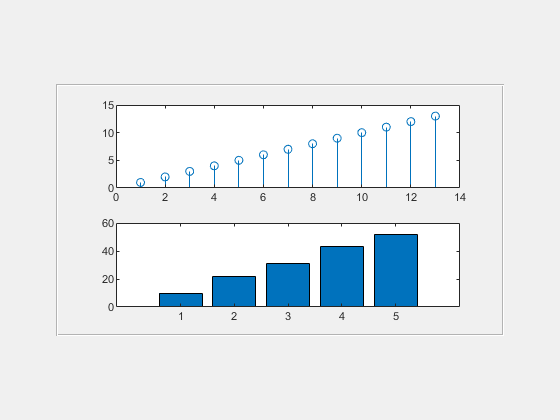
Create a panel in a figure. Then create a tiled chart layout t in the panel by specifying the panel object as the first argument to the tiledlayout function. By default, nexttile looks for the layout in the figure. However the layout is in a panel instead of a figure, so you must specify t as an input argument when you call nexttile.
p = uipanel('Position',[.1 .2 .8 .6]);
t = tiledlayout(p,2,1);

% Tile 1
nexttile(t)
stem(1:13)

% Tile 2
nexttile(t)
bar([10 22 31 43 52])
Occasionally, you might need to create the axes by calling one of the axes functions (axes, polaraxes, or geoaxes). When you create the axes with one of these functions, specify the parent argument as the tiled chart layout. Then position the axes by setting the Layout property on the axes.
Create a tiled chart layout t and specify the 'flow' tile arrangement. Display a plot in each of the first three tiles.
t = tiledlayout('flow');
nexttile
plot(rand(1,10));
nexttile
plot(rand(1,10));
nexttile
plot(rand(1,10));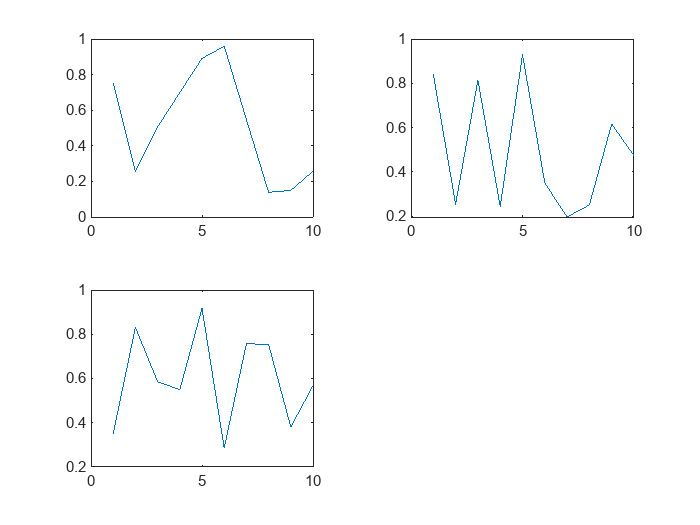
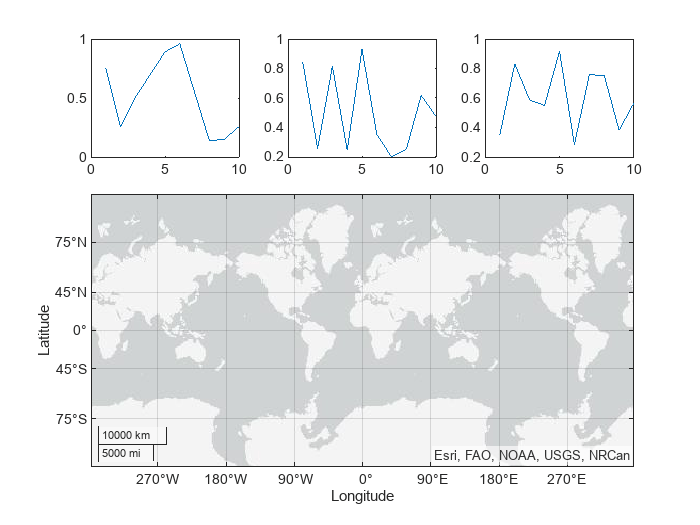
Create a geographic axes object gax by calling the geoaxes function and specify t as the parent argument. By default, the axes goes into the first tile, so move it to the fourth tile by setting gax.Layout.Tile to 4. Span the axes across a 2-by-3 region of tiles by setting gax.Layout.TileSpan to [2 3].
gax = geoaxes(t);
gax.Layout.Tile = 4;
gax.Layout.TileSpan = [2 3];
Call the geoplot function. Then configure the map center and zoom level for the axes.
geoplot(gax,[47.62 61.20],[-122.33 -149.90],'g-*')
gax.MapCenter = [47.62 -122.33];
gax.ZoomLevel = 2;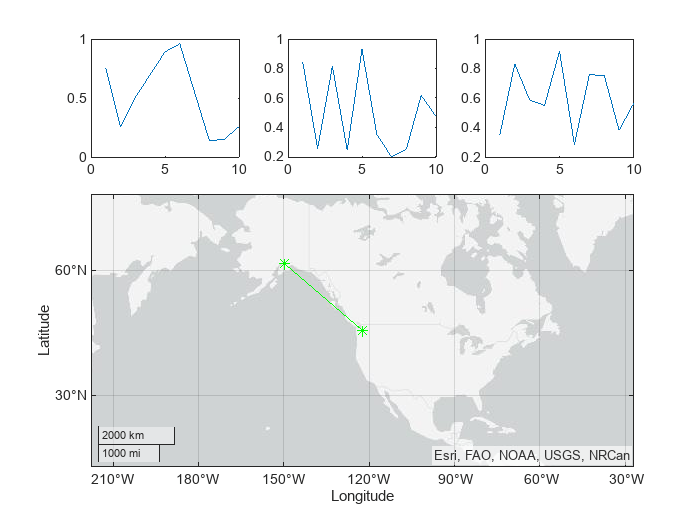
Input Arguments
Tile location, specified one of the values from the table.
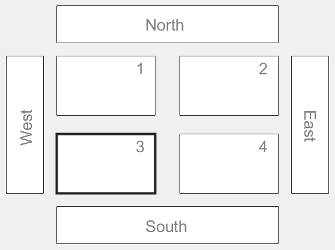
The labeled rectangles in the following examples illustrate the tiles in the grid
and the outer tiles of a layout with the default TileIndexing
scheme. In practice, the grid is invisible and the outer tiles do not take up space
until you populate them with axes. The rectangles with thicker borders reflect the
selected tile in each example.
tilelocation | Description | Example |
|---|---|---|
| Positive whole number | One of the tiles from the grid in the center of the layout. By default,
the tile numbers start at 1 and increase from left-to-right
and top-to-bottom. | Create a 2-by-2 layout and select the third tile in the grid. tiledlayout(2,2) nexttile(3)
|
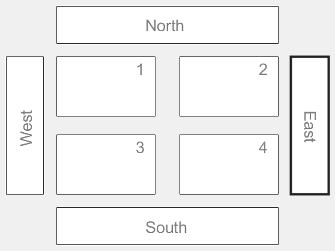
'north', 'south',
'east', or 'west' | One of the tiles around the outside of the grid. | Create a 2-by-2 layout and select the east tile, which is to the right of the grid. tiledlayout(2,2)
nexttile('east')
|
Note
If the tile you specify is empty, nexttile places an axes
object into that tile. If the tile contains an axes object or standalone
visualization, then that object becomes the current axes, so the next plotting command
can plot into that tile.
Tile span, specified as a vector of the form [r c], where
r and c are positive whole numbers. Use this
argument to make the axes span r rows by c columns
of tiles in the layout.
If you specify the span argument without the
tilelocation argument, nexttile places the
upper left corner of the axes in the upper left corner of the first empty
r-by-c region in the layout.
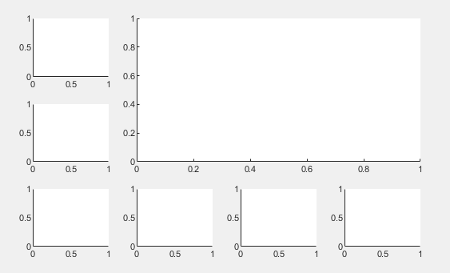
However, if you specify both the tilelocation and
span arguments, nexttile places the upper left
corner of the axes in the upper left corner of the tile specified by
tilelocation. For example, the large axes on the right side of this
3-by-4 layout has a tile number of
2 and a span of [2 3].
TiledChartLayout object to place the axes into. This argument is
useful when you are working with multiple layouts, or when the layout is in a panel or
tab instead of a figure. When you do not specify t,
nexttile looks for the layout in the current figure.
Version History
Introduced in R2019b