pie
Legacy pie chart
Description
Note
piechart
is recommended over pie because it enables you to create a
PieChart object, which provides more customization options. For
example, PieChart objects have properties for changing the slice
colors, the arrangement of the slices around the circle (clockwise or
counterclockwise), and the location of the first slice. (since R2023b)
pie( draws a pie chart using the data
in X)X. Each slice of the pie chart represents an element in
X.
If
sum(X) ≤ 1, then the values inXdirectly specify the areas of the pie slices.piedraws only a partial pie ifsum(X) < 1.If
sum(X) > 1, thenpienormalizes the values byX/sum(X)to determine the area of each slice of the pie.If
Xis of data typecategorical, the slices correspond to categories. The area of each slice is the number of elements in the category divided by the number of elements inX.
pie( offsets
slices from the pie. X,explode)explode is a vector or matrix
of zeros and nonzeros that correspond to X. The pie function
offsets slices for the nonzero elements only in explode.
If X is of data type categorical,
then explode can be a vector of zeros and nonzeros
corresponding to categories, or a cell array of the names of categories
to offset.
Examples
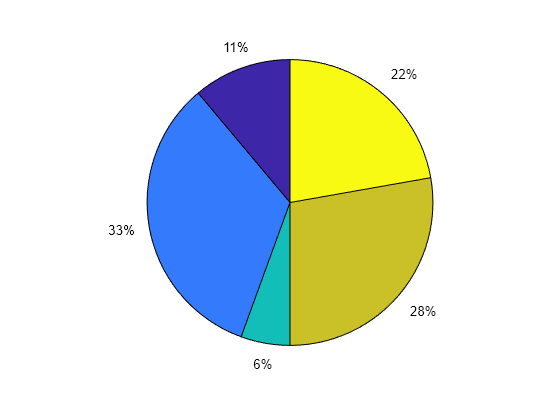
Create a pie chart of vector X.
X = [1 3 0.5 2.5 2];
pie(X)
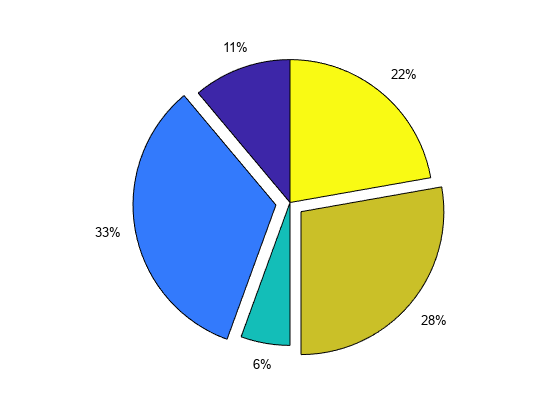
Offset the second and fourth pie slices by setting the corresponding explode elements to 1.
explode = [0 1 0 1 0];
pie(X,explode)
Create a pie chart of vector X and label the slices.
X = 1:3;
labels = {'Taxes','Expenses','Profit'};
pie(X,labels)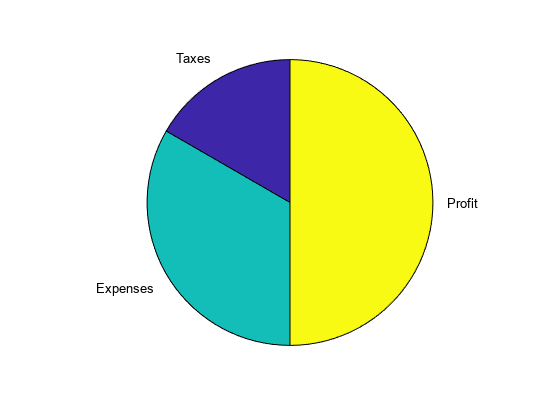
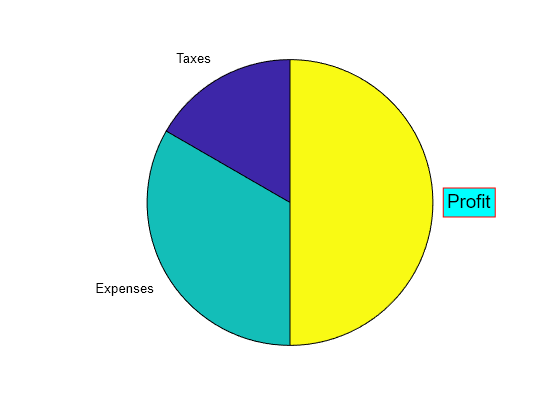
Create a labeled pie chart, and then modify the color and font size of the text labels.
X = 1:3;
labels = {'Taxes','Expenses','Profit'};
p = pie(X,labels)
p =
  1×6 graphics array:

    Patch    Text     Patch    Text     Patch    Text
Get the text object for the label 'Profit'. Change its color and font size. Use dot notation to set properties.
t = p(6);
t.BackgroundColor = 'cyan';
t.EdgeColor = 'red';
t.FontSize = 14;
Create a pie chart, and specify a format expression to display each label with three digits after the decimal point. To include a percent sign in the labels, specify '%%' at the end of the expression.
X = [1/3 2/3];
pie(X,'%.3f%%')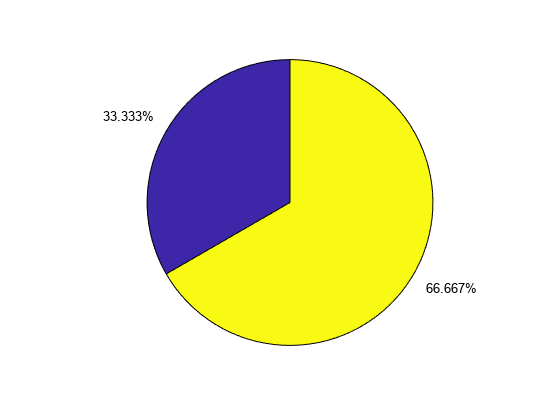
Create a pie chart of vector X where the sum of the elements is less than 1.
X = [0.19 0.22 0.41];
pie(X)
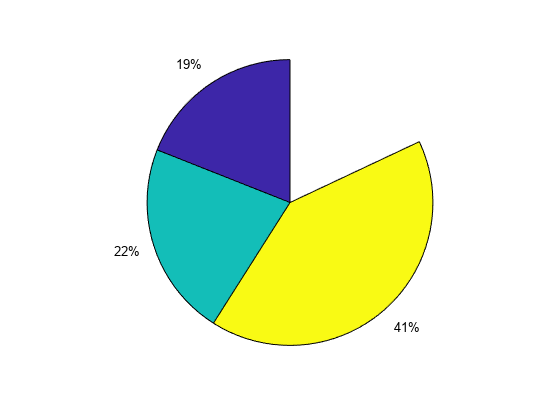
pie draws a partial pie because the sum of the elements is less than 1.
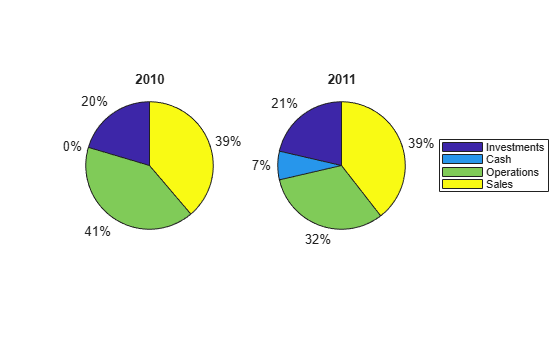
Create vectors y2010 and y2011, that contain financial data for two years. Then create a cell array containing the labels for the values.
y2010 = [50 0 100 95];
y2011 = [65 22 97 120];
labels = {'Investments','Cash','Operations','Sales'};
Create a 1-by-2 tiled chart layout, and display two pie charts that each have a title. Then display a shared legend in the east tile of the layout. To do this, call the legend function with a return argument to store the legend object. Then move the legend to the east tile by setting the Layout.Tile property to 'east'.
t = tiledlayout(1,2,'TileSpacing','compact');

% Create pie charts
ax1 = nexttile;
pie(ax1,y2010)
title('2010')

ax2 = nexttile;
pie(ax2,y2011)
title('2011')

% Create legend
lgd = legend(labels);
lgd.Layout.Tile = 'east';
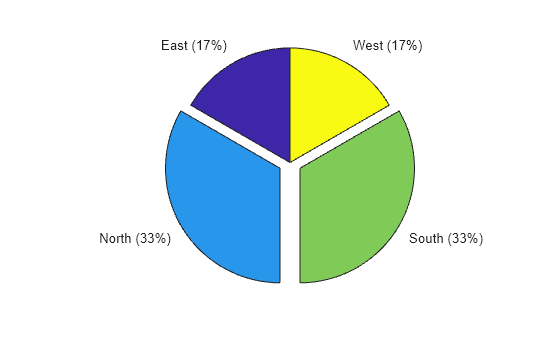
Plot a categorical pie chart with offset slices corresponding to categories.
X = categorical({'North','South','North','East','South','West'});
explode = {'North','South'};
pie(X,explode)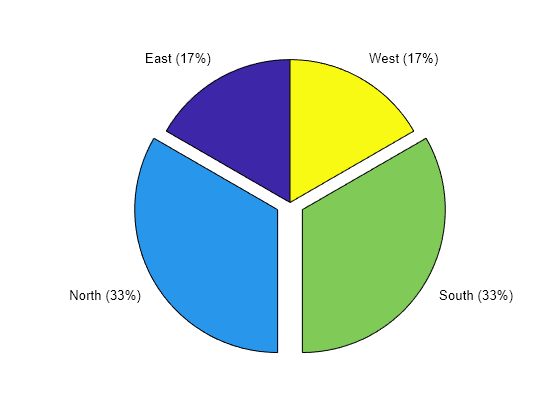
Now, use a logical vector to offset the same slices.
explode = [0 1 1 0];
pie(X,explode)
Plot a categorical pie chart without any offset slices and label the slices. When X is of data type categorical you must specify the input argument explode. To specify labels without any offset slices, specify explode as an empty cell array, and labels as the labels.
X = categorical({'North','South','North','East','South','West'});
explode = {};
labels = {'E','N','S','W'};
pie(X,explode,labels)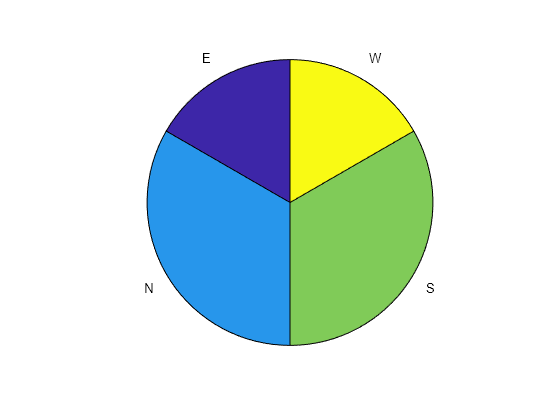
Now, offset a slice and label all slices.
X = categorical({'North','South','North','East','South','West'});
explode = {'West'};
labels = {'E','N','S','W'};
pie(X,explode,labels)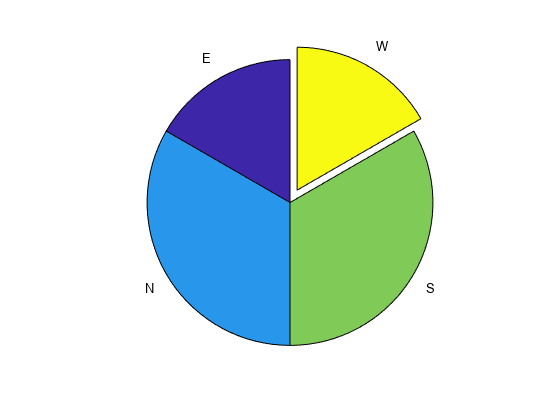
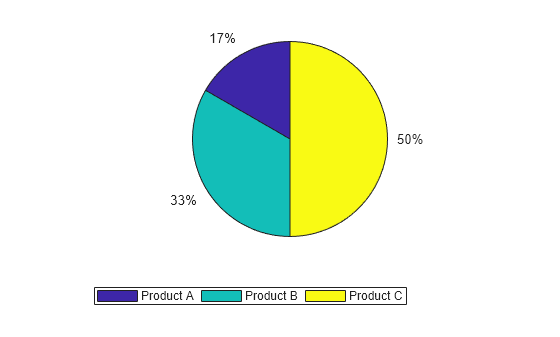
Define x and create a pie chart.
x = [1 2 3];
pie(x)

Specify the description for each pie slice in the cell array labels. Specify the descriptions in the order that you specified the data in x.
labels = ["Product A","Product B","Product C"];
Display a horizontal legend below the pie chart. Pass the descriptions contained in labels to the legend function. Set the legend's Location property to "southoutside" and its Orientation property to "horizontal".
legend(labels,"Location","southoutside","Orientation","horizontal")
Input Arguments
Input vector or matrix.
If
Xis numeric, then all values inXmust be finite.If
Xis categorical, thenpieignores undefined elements.
Data Types:
double|categorical
Offset slices, specified as a numeric vector or matrix, logical vector or matrix, string array, or cell array of character vectors.
If
Xis numeric, thenexplodemust be a logical or numeric vector or matrix of zeros and nonzeros that correspond toX. A true (nonzero) value offsets the corresponding slice from the center of the pie chart, so thatX(i,j)is offset from the center ifexplode(i,j)is nonzero.explodemust be the same size asX.If
Xis categorical, thenexplodecan be a string array or cell array of category names.pieoffsets slices corresponding to categories inexplode.If
Xis categorical, thenexplodealso can be a logical or numeric vector with elements that correspond to each category inX. Thepiefunction offsets slices corresponding to true (nonzero) in category order.
Label options, specified as an array of text labels or a format expression. Use this argument to display custom text labels with the pie slices, or to display the percentage values that MATLAB® provides in a specific format.
Note
To specify the label options when X contains categorical
values, you must specify the explode argument before the label
options.
Display Text Labels
Specify the labels as a cell array of character vectors or as a string array.
When X contains numeric values, the number of elements in
labels must equal the number of elements in
X.
When X contains categorical values, the number and order of the
elements in labels must equal the number and order of the
categories in X. To determine the number and order of the
categories, use the categories function.
Display Percentages in a Specific Format
Specify a format expression as a character vector or as a string scalar. The
format expression begins with a percent symbol (%) followed by a
series of identifiers.
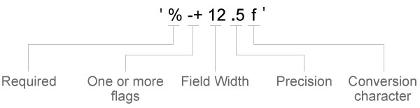
All the identifiers are optional except for the conversion character. Specify the identifiers in this order:
One or more flags — Options for displaying plus signs, decimal points, and justifying the labels.
Plus sign (
+) — Display a plus sign next to positive values.Hash symbol (
#) — Display the decimal point even when the precision is0, such as in'50.'.Minus sign (
–) — Left justify the labels and pad the ends of the labels with spaces instead of padding them at the beginning.
Field width — Minimum number of characters to display in the label. Specify the field width as an integer value. If the number of digits in a label is smaller than the field width, then the label is padded with spaces.
Precision — Number of digits to the right of the decimal point. Specify the precision as a decimal point followed by an integer value.
Conversion character — Fixed-point or exponential notation. For a list of conversion characters, see the table below. If you specify a conversion character that does not fit the data, MATLAB uses
%einstead.
| Conversion Character | Description | Example |
|---|---|---|
f | Fixed-point notation. The precision value indicates the number of decimal places. | '%.4f%%' displays the label for a slice that is 6.25%
of the pie as 6.2500%. |
e | Exponential notation. The precision value indicates the number of decimal places. | '%.4e%%' displays the label for a slice that is 6.25%
of the pie as 6.2500e+00%. |
g | The more compact version of e or f,
with no trailing zeros. The precision value indicates the maximum number of
decimal places. | '%.4g%%'displays the label for a slice that is 6.25%
of the pie as 6.25%. |
In addition to the identifiers listed above, you can also specify literal text at
the beginning or end of the format expression. To display a single quotation mark, use
''. To display a percent symbol, use %%. For
example, '%.2f%%' displays the labels with two trailing decimal
places followed by a percent symbol.
Axes object. Use ax to plot the pie chart
in a specific axes instead of the current axes (gca).