pie3
3-D pie chart
Description
pie3( draws a three-dimensional pie chart
using the data in X)X. Each slice of the pie chart represents an element in
X.
pie3( plots into the axes
specified by ax,___)ax instead of into the current axes
(gca). The argument ax can precede any of the input
argument combinations in the previous syntaxes.
p = pie3(___)Patch, Surface, and Text
objects that make up the pie chart. Use p to modify properties of the
chart after creating it. For a list of properties you can set for these objects, see
Patch Properties, Surface Properties, and Text Properties.
Examples
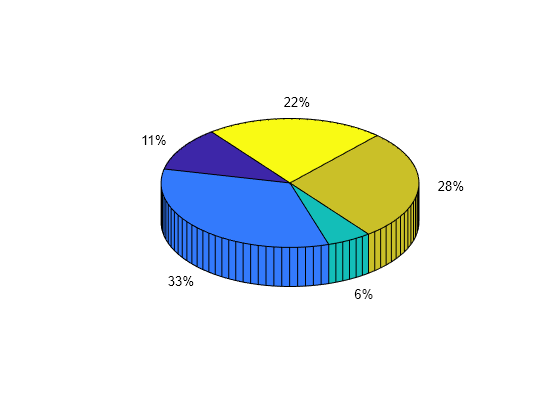
Create a 3-D pie chart of vector X.
X = [1 3 0.5 2.5 2];
pie3(X)
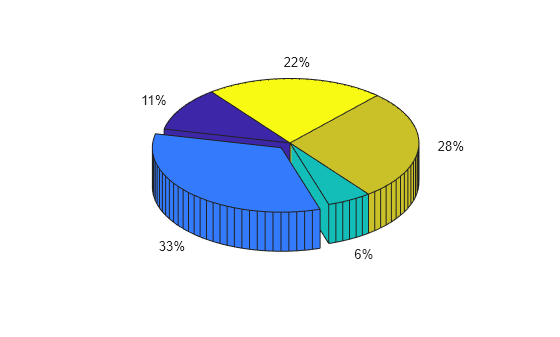
Create a 3-D pie chart and offset a slice by specifying the corresponding explode element as 1.
X = [1 3 0.5 2.5 2];
explode = [0 1 0 0 0];
pie3(X,explode)
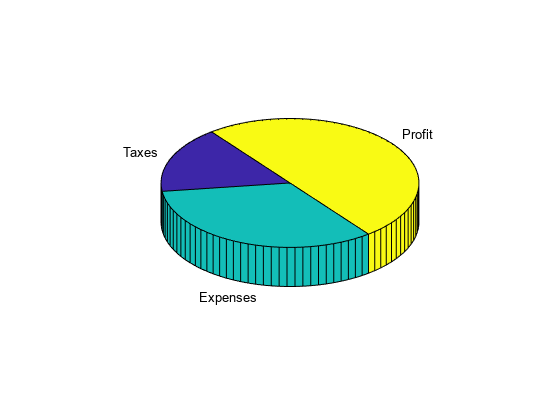
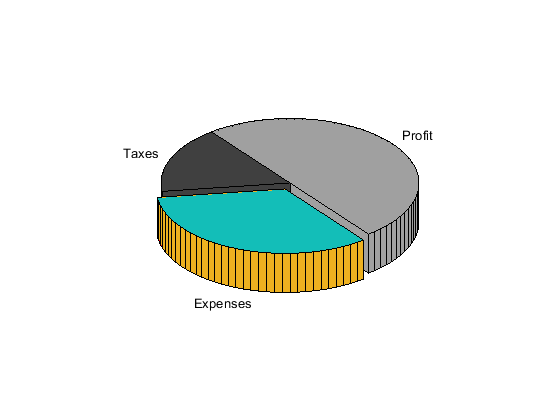
Create a 3-D pie chart and specify the text labels.
X = 1:3;
labels = ["Taxes" "Expenses" "Profit"];
pie3(X,labels)
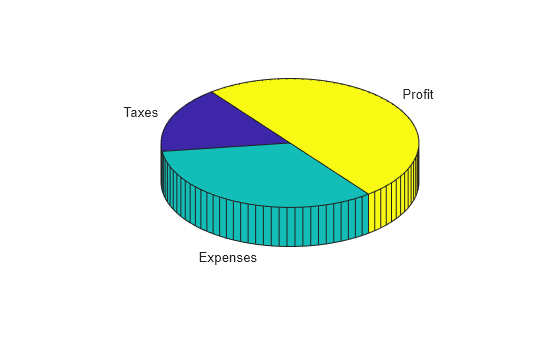
Create a 3-D pie chart and modify the font style of one of the labels.
First, create a 3-D pie chart with the default font styling. Specify an output argument, p, so that you can use it to customize the pie chart.
X = [1 2 3];
labels = ["Taxes" "Expenses" "Profit"];
p = pie3(X,labels);
Each slice in the pie chart has four corresponding elements in p: Patch, Surface, Patch, and Text.
p'
ans =
  12×1 graphics array:

  Patch
  Surface    (Taxes)
  Patch
  Text       (Taxes)
  Patch
  Surface    (Expenses)
  Patch
  Text       (Expenses)
  Patch
  Surface    (Profit)
  Patch
  Text       (Profit)
Get the Text object for the label Expenses. Change its color and font size by using dot notation to set the associated properties.
t = p(8);
t.Color = "red";
t.FontSize = 14;
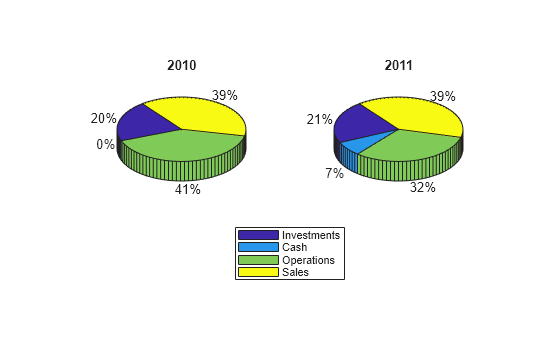
Compare two 3-D pie charts by plotting them in the same figure using a tiled chart layout.
Create vectors of financial data for 2010 and 2011 and a set of labels.
y2010 = [50 0 100 95];
y2011 = [65 22 97 120];
labels = ["Investments" "Cash" "Operations" "Sales"];
Create a 2-by-1 tiled chart layout. Create a pie chart for 2010 in the first tile and for 2011 in the second tile. Add a shared legend for the pie charts.
t = tiledlayout(1,2,"TileSpacing","None");
ax1 = nexttile;
pie3(ax1,y2010)
title("2010")

ax2 = nexttile;
pie3(ax2,y2011)
title("2011")

l = legend(labels);
l.Layout.Tile = "south";
Input Arguments
Output Arguments
Graphics objects that make up the pie chart, returned as a vector of
Patch, Surface, and Text objects.
Each slice in the pie chart consists of four objects that you can use to modify the
chart appearance. As a result, the length of the output vector is four times the number
of elements in X. Each slice has four corresponding elements in
p in this order:
Patchobject – Bottom layer (not visible in the image)Surfaceobject – Surface between top and bottom layer (orange in the image)Patchobject – Top layer (blue in the image)Textobject – Text label
For more information about the properties you can set for these objects, see Patch Properties, Surface Properties, and Text Properties.