Optimize Parameters for Second-Order DSM in Simulink
Define the performance specifications of a second-order DSM.
outputTable=table();
outputTable.Test=["ACMeas";"ACMeas";"ACMeas";"ACMeas";"ACMeas"];
outputTable.Name={'SNR';'SFDR';'SINAD';'ENOB';'NoiseFloor'};
outputTable.Units={'dB';'dB';'dB';'bits';'dB'};
outputTable.Spec={'> 72';'> 74';'> 72';'maximize 11.5';'< -78'}
outputTable=5×4 table
      Test           Name          Units            Spec
    ________    ______________    ________    _________________

    "ACMeas"    {'SNR'       }    {'dB'  }    {'> 72'         }
    "ACMeas"    {'SFDR'      }    {'dB'  }    {'> 74'         }
    "ACMeas"    {'SINAD'     }    {'dB'  }    {'> 72'         }
    "ACMeas"    {'ENOB'      }    {'bits'}    {'maximize 11.5'}
    "ACMeas"    {'NoiseFloor'}    {'dB'  }    {'< -78'        }
Define the variables to optimize.
variableTable=table();
variableTable.parameters={'a1';'a2';'b1';'b2'};
variableTable.values=["0.15:0.005:0.16";"0.55:0.005:0.7";"0.15:0.005:0.16";"0.55:0.005:0.7"]variableTable=4×2 table
parameters values
__________ _________________
{'a1'} "0.15:0.005:0.16"
{'a2'} "0.55:0.005:0.7"
{'b1'} "0.15:0.005:0.16"
{'b2'} "0.55:0.005:0.7"
Create the msbOptimizer object.
moptimizer = msbOptimizer(SimulationEnvironment='simulink',OutputsSetup=outputTable,VariableSetup=variableTable,DesignName='DSM2ndOrder')
moptimizer =
  msbOptimizer with properties:

               DesignName: 'DSM2ndOrder'
                   Solver: "surrogateopt"
    SimulationEnvironment: 'simulink'
             BestSolution: []
              BestMetrics: []
     FinalOptimizerStatus: []
             OutputsSetup: [5×4 table]
          ParametersSetup: [4×2 table]
           ParameterNames: ["a1"    "a2"    "b1"    "b2"]
          ParameterValues: ["0.15:0.005:0.16"    "0.55:0.005:0.7"    "0.15:0.005:0.16"    "0.55:0.005:0.7"]
                    Eflag: []
                   Trials: []
              Constraints: [5×9 table]
                  Corners: []
Optimize the parameters.
[sol,metric] = moptimizer.optimizeDesign
Maximum number of simulations: 100
Number of parallel simulations: 1
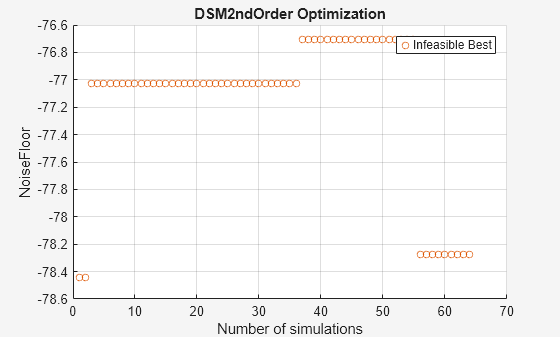
Optimizer was able to meet all the specifications.
sol=4×2 table
    Name    Value
    ____    _____

    "a1"     0.15
    "a2"    0.575
    "b1"    0.155
    "b2"    0.635
metric=5×4 table
        Name        FinalMetrics         Specs         Units
    ____________    ____________    _______________    ______

    "SNR"              72.519       "> 72"             "dB"
    "SFDR"             80.869       "> 74"             "dB"
    "SINAD"            72.519       "> 72"             "dB"
    "ENOB"             11.754       "maximize 11.5"    "bits"
    "NoiseFloor"      -80.755       "< -78"            "dB"
As you can see, the function meets the required specifications. You can use the check point file to continue further optimization from the current state.