plotresponse
Plot dynamic network time series response
Syntax
plotresponse(t,y)

plotresponse(t1,'name',t2,'name2',...,y)

plotresponse(...,'outputIndex',outputIndex)
Description
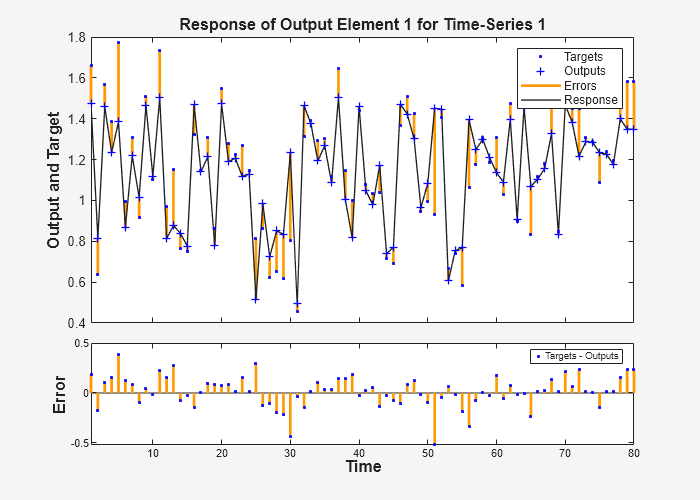
plotresponse(t,y) takes a target time series t and
an output time series y, and plots them on the same axis showing the errors
between them.
plotresponse(t1,'name',t2,'name2',...,y) takes multiple target/name
pairs, typically defining training, validation and testing targets, and the output. It plots the
responses with colors indicating the different target sets.
plotresponse(...,'outputIndex',outputIndex) optionally defines which
error element is being correlated and plotted. The default is 1.
Examples
Plot Target and Output Time Series Data
This example shows how to use a NARX network to solve a time series problem.
[X,T] = simplenarx_dataset;
net = narxnet(1:2,20);
[Xs,Xi,Ai,Ts] = preparets(net,X,{},T);
net = train(net,Xs,Ts,Xi,Ai);
Y = net(Xs,Xi,Ai);
plotresponse(Ts,Y)
Version History
Introduced in R2010b