ROC Curve for Noncoherent Integration
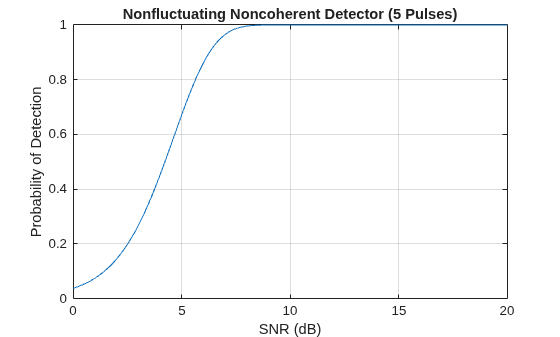
R2026bExamine the effect of SNR on the probability of detection for a detector using noncoherent integration with a false-alarm probability of 1e-4. Assume the target has a nonfluctuating RCS and that you are integrating over 5 pulses.
[Pd,SNR] = rocpfa(1e-4,...
    'SignalType','NonfluctuatingNoncoherent',...
    'NumPulses',5);
figure;
plot(SNR,Pd); xlabel('SNR (dB)');
ylabel('Probability of Detection'); grid on;
title('Nonfluctuating Noncoherent Detector (5 Pulses)');