Calculate Memory Use of Functions in C/C++ Code
R2026bYou can use Polyspace®
Test™ to calculate how much stack memory is used by callable entities in your C/C++ code. See Memory Use.
Review the Memory Use results to:
Determine whether your code meets the memory constraints of your target hardware.
Identify code sections that require memory optimization.
Prerequisite
To follow this topic, copy the content of the folder <polyspaceroot>\polyspace\examples\doc_pstest\memory_use to a writable folder. Here, <polyspaceroot> is the Polyspace
Test installation folder, for instance, C:\Program Files\Polyspace\R2026b. The folder contains a subfolder src, where the required sources are stored. A Makefile to generate the memory use report is also available in the folder.
Before using the Makefile, specify your installation folder as the variable POLYSPACEROOT. For details about using Makefiles to calculate code profile, see Calculate Code Profile by Using Makefile.
The code in this folder demonstrates a convolution algorithm and includes an xUnit test that verifies the accuracy of the implementation.
Calculate Memory Use
You can calculate the memory use of your source code either using the Polyspace Platform user interface or the command line.
Use Polyspace Platform User Interface
To calculate the memory use using the Polyspace Platform user interface:
Create a new Polyspace Platform project.
Add the file
src/src.cto the project. Parse the added code.Add the Polyspace xUnit test file
test/test.c.In the Profiling section of the toolstrip, select Memory Use from the drop-down menu.
Open the Testing and Profiling pane in the Configuration tab. Specify the folder
memory_use\srcin the field Folders to profile.Click Build Project and then Run Tests to run the added test. This steps generates the results.
Use Command Line
At the command line, you can either use the make utility or the polyspace-code-profiler command.
If you have the make utility:
Open the file
Makefileand specify your installation folder as the variablePOLYSPACEROOT.Navigate to the folder where you copied the content of
memory_useand, at the command line, enter:Themake reportHTMLreport containing theMemory Useresults is stored in the folderreportFolder.
To calculate the memory use results using the command polyspace-code-profiler, use these scripts:
After executing these commands, the HTML report containing the Memory Use is stored in the folder reportFolder. For details about these commands, see Calculate Execution Time and Memory Use of C/C++ Code Using Self-Managed Builds.
Open Memory Use Results
After calculating the memory use, you can open and review your results on the Dashboard in the Polyspace Platform user interface or the Polyspace Access™ web interface. For more information, see Review Memory Use of Functions in C/C++ Code.
View Memory Use Results on Dashboard
In the Dashboard perspective, you can see the Project Overview dashboard showing the metric Stack (Max), and the Memory Profiling dashboard showing a breakdown of memory use by file and function.
For more details about the dashboard content, see Review Memory Use of Functions in C/C++ Code.
View Memory Use Results in Report
You can open an HTML report containing details of memory use results.
If you use the Polyspace Platform user interface:
At the Results pane, right -click Memory Profiling and select Open Review.
The user interface does not support reviewing the
Memory Useresults directly. At the prompt, selectYesto open the HTML report.Select a location to save the
HTMLreport.The HTML report opens in your browser.
If you use the command line, the HTML report is already produced. Open the report in the folder reportFolder.
The results list the functions invoked in the code, the number of times each function is called, and their memory use in bytes.
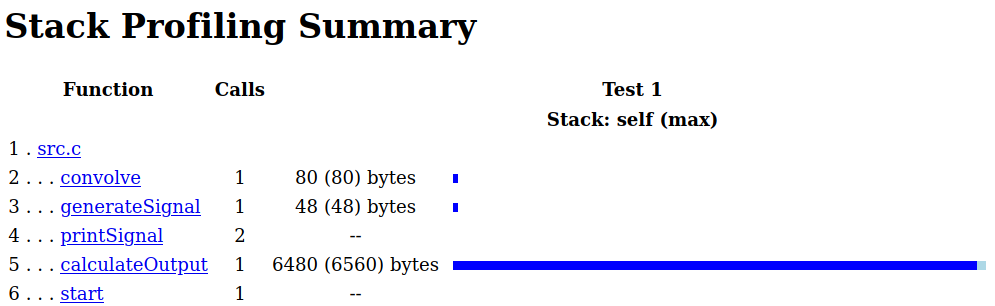
The report contains both the self memory use and the max memory use (in parenthesis). The self memory use represent the stack use of a function excluding the stack use of its called functions. The max memory use indicate the memory use of a function including all the called functions in different execution paths. See Memory Use.
Your results might vary slightly from the preceding results. Click each individual function to see more details about them.
Address Large Stack Usage
Review the results to identify functions with disproportionately high memory use. The results indicate that the function calculateOutput() might require memory optimization.
After reviewing the code, the function calculateOutput() uses large amount of the stack because it stores a 800 element input signal as a local variable before calculating the output signal. Depending on your platform, the memory use of calculateOutput() might be acceptable. If you want to reduce the memory use of your functions, consider these strategies:
Consider working with a smaller array. For instance, to calculate the output signal, all 800 samples of the input signal are not necessary at the same time. In this example, the output signal is calculated by convolving the input signal with a 5th order finite impulse response filter. In this case, the
nthelement of the output signal can be calculated by using the 5 preceding elements of the input signal. Using this strategy, it is possible to calculate the output signal without storing the 800 element input signal in the stack.Consider using the heap to store large arrays. Using the heap might increase the execution time, but this strategy reduces the possibility of a stack overflow.
Consider passing arguments by using references or pointers. Passing by value creates temporary copies of the passed objects in the stack.
For instance, setting the macro SIGNAL_LENGTH in src.h to 50 instead of 800 reduces the memory use of calculateOutput() to around 500 bytes.
See Also
polyspace-code-profiler | Memory Use

