Compare Logistic Model for Lifetime PD to Champion Model
This example shows how to compare a new Logistic model for lifetime PD against a "champion" model.
Load Data
Load the portfolio data, which includes loan and macro information.
load RetailCreditPanelData.mat
data = join(data,dataMacro);
disp(head(data))
ID ScoreGroup YOB Default Year GDP Market
__ __________ ___ _______ ____ _____ ______
1 Low Risk 1 0 1997 2.72 7.61
1 Low Risk 2 0 1998 3.57 26.24
1 Low Risk 3 0 1999 2.86 18.1
1 Low Risk 4 0 2000 2.43 3.19
1 Low Risk 5 0 2001 1.26 -10.51
1 Low Risk 6 0 2002 -0.59 -22.95
1 Low Risk 7 0 2003 0.63 2.78
1 Low Risk 8 0 2004 1.85 9.48
nIDs = max(data.ID);
uniqueIDs = unique(data.ID);

rng('default'); % for reproducibility
c = cvpartition(nIDs,'HoldOut',0.4);

TrainIDInd = training(c);
TestIDInd = test(c);

TrainDataInd = ismember(data.ID,uniqueIDs(TrainIDInd));
TestDataInd = ismember(data.ID,uniqueIDs(TestIDInd));
Fit Logistic Model
For this example, fit a new Logistic model using only score group information but no age information. First, you can validate this model in a standalone fashion. For more information, see Basic Lifetime PD Model Validation.
Age information is important in this data set. The new model does not perform as well as the champion model (which includes age, score group, and macro vars).
Fit a new Logistic model using fitLifetimePDModel.
ModelType = "logistic";
pdModel = fitLifetimePDModel(data(TrainDataInd,:),ModelType, ...
   'ModelID','LogisticNoAge', ...
   'IDVar','ID', ...
   'LoanVars','ScoreGroup', ...
   'MacroVars',{'GDP','Market'}, ...
   'ResponseVar','Default');
disp(pdModel)
  Logistic with properties:

            ModelID: "LogisticNoAge"
        Description: ""
    UnderlyingModel: [1×1 classreg.regr.CompactGeneralizedLinearModel]
              IDVar: "ID"
             AgeVar: ""
           LoanVars: "ScoreGroup"
          MacroVars: ["GDP"    "Market"]
        ResponseVar: "Default"
         WeightsVar: ""
       TimeInterval: []
Compare Performance of the Logistic Model to Champion Model
To compare the new Logistic model to a champion model, you need access to the predictions of the champion model. The champion model might even have different predictors, so the mapping between the data being used and the exact inputs of the champion model might require an intermediate preprocessing step. This example assumes that you have a black-box tool to get the predictions from the champion model.
Compare the model performance for both models using modelDiscrimination.
DataSetChoice ="Testing"; if DataSetChoice=="Training" Ind = TrainDataInd; else Ind = TestDataInd; end ChampionPD = getChampionModelPDs(data(Ind,:)); [DiscMeasure,DiscData] = modelDiscrimination(pdModel,data(Ind,:),'ShowDetails',true,'DataID',DataSetChoice, ... 'ReferencePD',ChampionPD,'ReferenceID',"Champion"); disp(DiscMeasure)
AUROC Segment SegmentCount WeightedCount
_______ __________ ____________ _____________
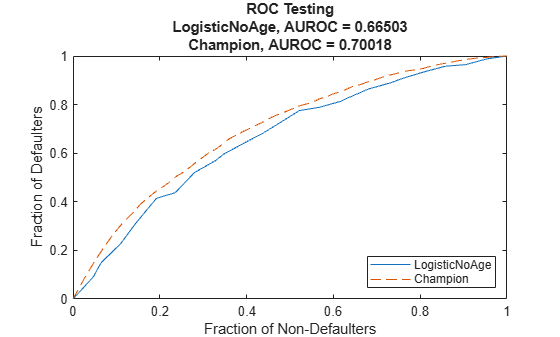
LogisticNoAge, Testing 0.66503 "all_data" 2.5863e+05 2.5863e+05
Champion, Testing 0.70018 "all_data" 2.5863e+05 2.5863e+05
disp(head(DiscData))
        ModelID           X           Y           T
    _______________    ________    ________    ________

    "LogisticNoAge"           0           0     0.02287
    "LogisticNoAge"     0.04673    0.090978     0.02287
    "LogisticNoAge"    0.064656     0.14922    0.022711
    "LogisticNoAge"     0.10982     0.22764    0.020553
    "LogisticNoAge"     0.14421       0.311    0.018483
    "LogisticNoAge"     0.19237     0.41454     0.01722
    "LogisticNoAge"     0.23558     0.43738    0.014125
    "LogisticNoAge"     0.27979     0.52037    0.012812
disp(tail(DiscData))
     ModelID         X          Y           T
    __________    _______    _______    __________

    "Champion"    0.88743    0.98021     0.0032242
    "Champion"    0.90293    0.98477     0.0025583
    "Champion"    0.91884    0.98896     0.0023801
    "Champion"    0.93303    0.99239     0.0018756
    "Champion"    0.94995    0.99391     0.0017711
    "Champion"    0.96705    0.99695     0.0016436
    "Champion"    0.98295    0.99886     0.0012847
    "Champion"          1          1    0.00086887
Use modelDiscriminationPlot to plot the ROC.
modelDiscriminationPlot(pdModel,data(Ind,:),'DataID',DataSetChoice, ...
   'ReferencePD',ChampionPD,'ReferenceID',"Champion");
[DiscMeasure,DiscData] = modelDiscrimination(pdModel,data(Ind,:),'ShowDetails',true,'SegmentBy','YOB','DataID',DataSetChoice, ...
   'ReferencePD',ChampionPD,'ReferenceID',"Champion");
disp(DiscMeasure)
                                      AUROC     Segment    SegmentCount    WeightedCount
                                     _______    _______    ____________    _____________

    LogisticNoAge, YOB=1, Testing    0.64879       1          38728            38728
    Champion, YOB=1, Testing         0.64972       1          38728            38728
    LogisticNoAge, YOB=2, Testing    0.65699       2          37812            37812
    Champion, YOB=2, Testing         0.66496       2          37812            37812
    LogisticNoAge, YOB=3, Testing    0.63508       3          36973            36973
    Champion, YOB=3, Testing         0.64774       3          36973            36973
    LogisticNoAge, YOB=4, Testing    0.62656       4          36418            36418
    Champion, YOB=4, Testing         0.66204       4          36418            36418
    LogisticNoAge, YOB=5, Testing     0.6205       5          35818            35818
    Champion, YOB=5, Testing         0.65439       5          35818            35818
    LogisticNoAge, YOB=6, Testing    0.61739       6          35384            35384
    Champion, YOB=6, Testing         0.63156       6          35384            35384
    LogisticNoAge, YOB=7, Testing    0.64016       7          24730            24730
    Champion, YOB=7, Testing         0.63117       7          24730            24730
    LogisticNoAge, YOB=8, Testing    0.63339       8          12764            12764
    Champion, YOB=8, Testing         0.63339       8          12764            12764
disp(head(DiscData))
        ModelID        YOB       X          Y           T
    _______________    ___    _______    _______    _________

    "LogisticNoAge"     1           0          0     0.022711
    "LogisticNoAge"     1     0.12062    0.22401     0.022711
    "LogisticNoAge"     1     0.23459    0.41435     0.018483
    "LogisticNoAge"     1     0.33329    0.59151      0.01722
    "LogisticNoAge"     1     0.45578    0.69107      0.01151
    "LogisticNoAge"     1      0.5683    0.77452     0.009347
    "LogisticNoAge"     1     0.67031    0.84919    0.0087028
    "LogisticNoAge"     1     0.78943     0.9063    0.0064814
disp(tail(DiscData))
        ModelID        YOB       X         Y           T
    _______________    ___    _______    ______    __________

    "LogisticNoAge"     8           0         0      0.014125
    "LogisticNoAge"     8     0.31762    0.5625      0.014125
    "LogisticNoAge"     8     0.65751    0.8125     0.0071273
    "LogisticNoAge"     8           1         1     0.0040058
    "Champion"          8           0         0     0.0040291
    "Champion"          8     0.31762    0.5625     0.0040291
    "Champion"          8     0.65751    0.8125     0.0017711
    "Champion"          8           1         1    0.00086887
Compare Calibration Against Champion Model
Compare the calibration of the two models with modelCalibration.
GroupingVar ="YOB"; [CalMeasure,CalData] = modelCalibration(pdModel,data(Ind,:),GroupingVar,'DataID',DataSetChoice, ... 'ReferencePD',ChampionPD,'ReferenceID',"Champion"); disp(CalMeasure)
                                                 RMSE
                                              __________

    LogisticNoAge, grouped by YOB, Testing     0.0031021
    Champion, grouped by YOB, Testing         0.00046476
disp(head(CalData))
     ModelID      YOB       PD        GroupCount    WeightedCount
    __________    ___    _________    __________    _____________

    "Observed"     1      0.017636      38728           38728
    "Observed"     2      0.013303      37812           37812
    "Observed"     3      0.010846      36973           36973
    "Observed"     4      0.010709      36418           36418
    "Observed"     5     0.0093528      35818           35818
    "Observed"     6     0.0060197      35384           35384
    "Observed"     7     0.0034776      24730           24730
    "Observed"     8     0.0012535      12764           12764
disp(tail(CalData))
     ModelID      YOB       PD        GroupCount    WeightedCount
    __________    ___    _________    __________    _____________

    "Champion"     1      0.017244      38728           38728
    "Champion"     2      0.012999      37812           37812
    "Champion"     3      0.011428      36973           36973
    "Champion"     4      0.010693      36418           36418
    "Champion"     5     0.0085574      35818           35818
    "Champion"     6      0.005937      35384           35384
    "Champion"     7     0.0035193      24730           24730
    "Champion"     8     0.0021802      12764           12764
Use modelCalibrationPlot to visualize the model calibration.
modelCalibrationPlot(pdModel,data(Ind,:),GroupingVar,'DataID',DataSetChoice, ...
   'ReferencePD',ChampionPD,'ReferenceID',"Champion");

[CalMeasure,CalData] = modelCalibration(pdModel,data(Ind,:),["YOB","ScoreGroup"],'DataID',DataSetChoice, ...
   'ReferencePD',ChampionPD,'ReferenceID',"Champion");
disp(CalMeasure)
                                                            RMSE
                                                          _________

    LogisticNoAge, grouped by YOB, ScoreGroup, Testing    0.0036974
    Champion, grouped by YOB, ScoreGroup, Testing         0.0010716
disp(head(CalData))
     ModelID      YOB    ScoreGroup        PD        GroupCount    WeightedCount
    __________    ___    ___________    _________    __________    _____________

    "Observed"     1     High Risk       0.030877      13084           13084
    "Observed"     1     Medium Risk     0.013541      12998           12998
    "Observed"     1     Low Risk       0.0081449      12646           12646
    "Observed"     2     High Risk       0.022838      12567           12567
    "Observed"     2     Medium Risk     0.012376      12767           12767
    "Observed"     2     Low Risk       0.0046482      12478           12478
    "Observed"     3     High Risk       0.017651      12067           12067
    "Observed"     3     Medium Risk    0.0092652      12520           12520
unstack(CalData,'PD','ModelID')
ans=24×7 table
    YOB    ScoreGroup     GroupCount    WeightedCount    Champion     LogisticNoAge    Observed
    ___    ___________    __________    _____________    _________    _____________    _________

     1     High Risk        13084           13084         0.028165       0.019641       0.030877
     1     Medium Risk      12998           12998         0.014833      0.0099388       0.013541
     1     Low Risk         12646           12646         0.008422      0.0055911      0.0081449
     2     High Risk        12567           12567          0.02167       0.019337       0.022838
     2     Medium Risk      12767           12767         0.011123      0.0098141       0.012376
     2     Low Risk         12478           12478        0.0061856      0.0055194      0.0046482
     3     High Risk        12067           12067         0.019285       0.020139       0.017651
     3     Medium Risk      12520           12520        0.0098085       0.010179      0.0092652
     3     Low Risk         12386           12386        0.0054096      0.0057356       0.005813
     4     High Risk        11798           11798         0.018136       0.019175       0.018562
     4     Medium Risk      12325           12325        0.0091921      0.0096563      0.0094929
     4     Low Risk         12295           12295        0.0050562      0.0054292       0.004392
     5     High Risk        11481           11481         0.014818       0.014806       0.016288
     5     Medium Risk      12120           12120        0.0072853       0.007454      0.0080033
     5     Low Risk         12217           12217        0.0039358      0.0041822      0.0041745
     6     High Risk        11250           11250          0.01049       0.012153      0.0096889
      ⋮
Compare Two Models Under Development
You can also compare two new models under development.
pdModelTTC = fitLifetimePDModel(data(TrainDataInd,:),"probit", ...
   'ModelID','ProbitTTC', ...
   'AgeVar','YOB', ...
   'IDVar','ID', ...
   'LoanVars','ScoreGroup', ...
   'ResponseVar','Default', ...
   'Description',"TTC model, no macro variables, probit.");
disp(pdModelTTC)
  Probit with properties:

            ModelID: "ProbitTTC"
        Description: "TTC model, no macro variables, probit."
    UnderlyingModel: [1×1 classreg.regr.CompactGeneralizedLinearModel]
              IDVar: "ID"
             AgeVar: "YOB"
           LoanVars: "ScoreGroup"
          MacroVars: ""
        ResponseVar: "Default"
         WeightsVar: ""
       TimeInterval: 1
pdModelTTC.UnderlyingModel
ans =
Compact generalized linear regression model:
    probit(Default) ~ 1 + ScoreGroup + YOB
    Distribution = Binomial

Estimated Coefficients:
                              Estimate        SE         tStat       pValue
                              _________    _________    _______    ___________

    (Intercept)                 -1.8275     0.013636    -134.02              0
    ScoreGroup_Medium Risk     -0.26441     0.014158    -18.676     7.7165e-78
    ScoreGroup_Low Risk        -0.46734     0.016327    -28.624     3.371e-180
    YOB                       -0.081761    0.0031333    -26.094    4.2244e-150


388097 observations, 388093 error degrees of freedom
Dispersion: 1
Chi^2-statistic vs. constant model: 1.7e+03, p-value = 0
Compare the calibrations.
[CalMeasureTTC,CalDataTTC] = modelCalibration(pdModelTTC,data(Ind,:),["YOB","ScoreGroup"],'DataID',DataSetChoice, ...
   'ReferencePD',predict(pdModel,data(Ind,:)),'ReferenceID',pdModel.ModelID);
disp(CalMeasureTTC)
                                                            RMSE
                                                          _________

    ProbitTTC, grouped by YOB, ScoreGroup, Testing        0.0016726
    LogisticNoAge, grouped by YOB, ScoreGroup, Testing    0.0036974
unstack(CalDataTTC,'PD','ModelID')
ans=24×7 table
    YOB    ScoreGroup     GroupCount    WeightedCount    LogisticNoAge    Observed     ProbitTTC
    ___    ___________    __________    _____________    _____________    _________    _________

     1     High Risk        13084           13084           0.019641       0.030877     0.028114
     1     Medium Risk      12998           12998          0.0099388       0.013541     0.014865
     1     Low Risk         12646           12646          0.0055911      0.0081449    0.0087364
     2     High Risk        12567           12567           0.019337       0.022838     0.023239
     2     Medium Risk      12767           12767          0.0098141       0.012376     0.012053
     2     Low Risk         12478           12478          0.0055194      0.0046482    0.0069786
     3     High Risk        12067           12067           0.020139       0.017651     0.019096
     3     Medium Risk      12520           12520           0.010179      0.0092652    0.0097145
     3     Low Risk         12386           12386          0.0057356       0.005813    0.0055406
     4     High Risk        11798           11798           0.019175       0.018562     0.015599
     4     Medium Risk      12325           12325          0.0096563      0.0094929    0.0077825
     4     Low Risk         12295           12295          0.0054292       0.004392    0.0043722
     5     High Risk        11481           11481           0.014806       0.016288     0.012666
     5     Medium Risk      12120           12120           0.007454      0.0080033    0.0061971
     5     Low Risk         12217           12217          0.0041822      0.0041745    0.0034292
     6     High Risk        11250           11250           0.012153      0.0096889     0.010223
      ⋮
Black-Box Champion Prediction Function
function PD = getChampionModelPDs(data)

m = load('LifetimeChampionModel.mat');
PD = predict(m.pdModel,data);

end
See Also
fitLifetimePDModel | predict | predictLifetime | modelDiscrimination | modelCalibration | modelCalibrationPlot | Logistic | Probit | Cox