slreportgen.report.Diagram Class
Namespace: slreportgen.report
Superclasses: slreportgen.report.Reporter
Create diagram reporter
Description
Create a diagram reporter, including a diagram snapshot and caption, for a Simulink® or Stateflow® diagram.
Note
To use a Diagram reporter in a report, you must create the report using the
slreportgen.report.Report class.
The slreportgen.report.Diagram class is a handle class.
Creation
Description
diagram = Diagram()
diagram = Diagram(source) source. Adding this
reporter to a report creates a snapshot of the diagram. Then, the snapshot
displays in the report as an image with a caption. The snapshot image is
stored in the temporary folder of the report. When the report is closed, the
snapshot image is copied into the report and then, the image is deleted from
the temporary folder. To prevent the snapshot image file from being deleted,
use the Debug property of the report. See slreportgen.report.Report.
diagram = Diagram(PropertyName=Value)
Input Arguments
Properties
Methods
Examples
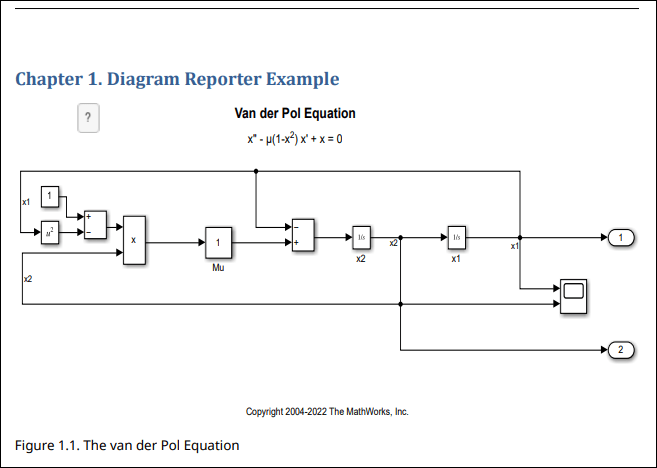
Add a snapshot of the top level of the vdp model to a report.
load_system("vdp")
import slreportgen.report.*
import mlreportgen.report.*
rpt = slreportgen.report.Report("output","pdf");

chapter = Chapter();
chapter.Title = "Diagram Reporter Example";

diagram = Diagram("vdp");
diagram.Snapshot.Caption = "The van der Pol Equation";
diagram.SnapshotFormat = "svg";
diagram.Snapshot.Height = "4in";

add(chapter,diagram);
add(rpt,chapter);
rptview(rpt);
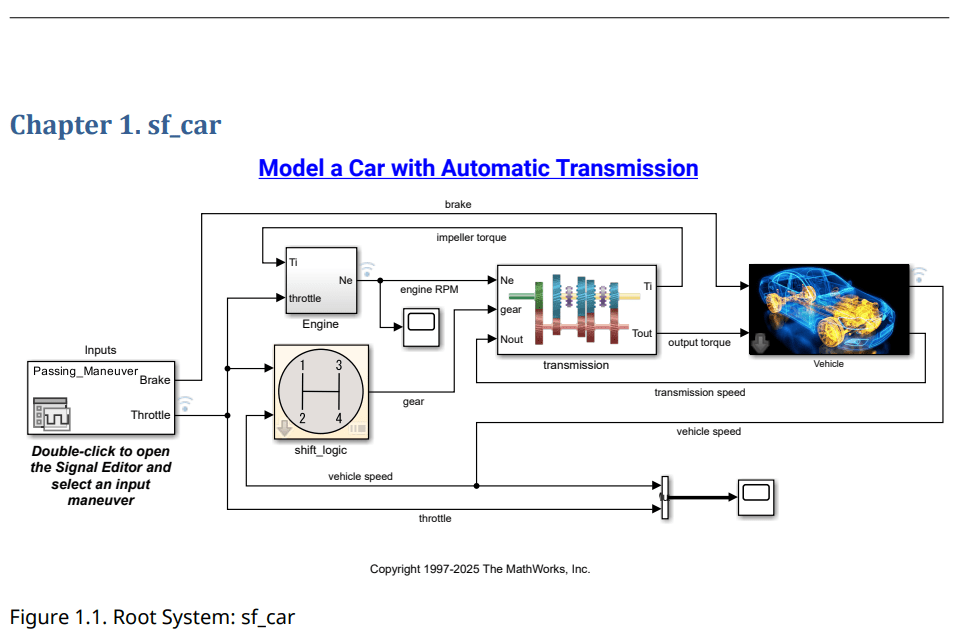
Create a PDF report and add diagram snapshots of the root system and a subsystem from the sf_car model to it. Add a hyperlink to the transmission subsystem and add a paragraph as the target for that link.
import mlreportgen.report.*
import slreportgen.report.*
import slreportgen.utils.*
import mlreportgen.dom.*
rpt = slreportgen.report.Report("output","pdf");
chapter = Chapter("sf_car");

model_name = "sf_car"
model_name =
"sf_car"
load_system(model_name);
diag1 = Diagram("sf_car");
diag1.Snapshot.Caption = "Root System: sf_car";
add(chapter,diag1);
add(chapter,PageBreak);

diag2 = Diagram("sf_car/Engine");
diag2.Snapshot.Caption = "Subsystem: sf_car/Engine";
add(chapter,diag2);
add(chapter, PageBreak);

para = Paragraph("Custom target for sf_car/transmission");
id = getObjectID("sf_car/transmission");
append(para,mlreportgen.dom.LinkTarget(id));
add(chapter,para);
add(chapter,PageBreak);

add(rpt,chapter);
close(rpt);
rptview(rpt);
close_system(model_name);
Use the SnapshotArea property to
specify the area of the diagram to capture in the snapshot. This example sets up
the view in the Simulink Editor and then sets the SnapshotArea
property to that view by calling slreportgen.utils.getCurrentEditorView.
Open the model.
openExample("f14")In the Simulink Editor, display the part of the diagram that you want to
capture in the snapshot. Get the current Simulink Editor view area by calling
slreportgen.utils.getCurrentEditorView.
editorViewArea = getCurrentEditorView();
Create the report and diagram reporter. Set the diagram snapshot area to the current editor viewing area. Add the diagram reporter to the report.
import slreportgen.report.*
import Slreportgen.utils.*
rpt = Report("output","pdf");

diag = Diagram("f14");
diag.SnapshotArea = editorViewArea;
add(rpt, diag);

close(rpt);
rptview(rpt);
Limitations
slreportgen.report.Diagramcannot snapshot diagrams from:Stateflow.StateTransitionTableChartStateflow.TruthTableChartStateflow.TruthTableStateflow.EMChart
Version History
Introduced in R2017bSee Also
slreportgen.report.Report | slreportgen.report.Reporter | slreportgen.finder.DiagramFinder | slreportgen.finder.DiagramElementFinder | slreportgen.finder.SystemDiagramFinder | slreportgen.finder.ChartDiagramFinder | slreportgen.finder.StateflowDiagramElementFinder | slreportgen.finder.StateFinder | slreportgen.report.StateflowObjectProperties | slreportgen.report.SimulinkObjectProperties | slreportgen.finder.BlockFinder | slreportgen.finder.AnnotationFinder