slreportgen.report.LookupTable Class
Namespace: slreportgen.report
Superclasses: slreportgen.report.Reporter
Lookup table block reporter
Description
Creation
Description
rptr = LookupTableLookupTable block reporter based on a default template.
Use its properties to specify the lookup table block on which to report and
specify report options.
rptr = LookupTable(lutobj)LookupTable block reporter for the lookup table
block specified by lutobj. By default, the reporter
generates a table and a plot of output values versus breakpoints, and a data
types table.
rptr = LookupTable(PropertyName=Value)LookupTable reporter properties using name-value arguments.
You can specify multiple name-value arguments in any order.
Input Arguments
Properties
Methods
Examples
This example shows how to add fixed content to a customized
HTML LookupTable reporter template. You can also customize your
lookup table report output by editing the report generator program directly. The
advantage of customizing a template is that you can reuse it as a basis for
customizing another report generator program.
The template and style sheets for the LookupTable reporter are
located in the
matlab\toolbox\shared\slreportgen\rpt\rpt\+slreportgen\+report\@LookupTable\resources\templates
folder. You do not need to specify this path when you copy the default
template.
Create a copy of the default html template. In this example, the template
package is saved as a zipped file named
CustomTemplate.htmtx in the current working
folder.
import mlreportgen.report.*
import slreportgen.report.*

LookupTable.createTemplate("CustomTemplate","html");
Unzip the template package.
unzipTemplate("CustomTemplate.htmtx");CustomTemplate and is saved in the current working
folder. The root.css file, which is in the
stylesheets subfolder, defines the styles that
control the appearance and formatting of the generated report. The
docpart_templates.html file specifies the holes that
hold the report contents when the report is generated.From the CustomTemplate folder, open the
docpart_templates.html file in a text editor outside
of MATLAB®.
<html>
  <head>
    <meta charset="utf-8" />
    <title>Document Part Templates</title>
    <link rel="StyleSheet" href="./stylesheets/root.css" type="text/css" />
  </head>  <body>
    <dplibrary>

      <!-- NOTE: temporary in the template library until the -->
      <!   DOM supports a source without template name -->
      <dptemplate name="LookupTable">
         <hole id="Content">LUT_CONTENT</hole>
         <hole id="LUTDataTypes">DATA_TYPE</hole>
         <hole id="FootNoteContent">LUT_FOOTNOTE_CONTENT</hole>
      </dptemplate>
      <dptemplate name="LookupTableContent">
         <hole id="TableContent">TABLECONTENT</hole>
         <hole id="FigureContent">FIGURECONTENT</hole>
      </dptemplate>
    </dplibrary>
  </body>
</html>
To add fixed text to the template, place it in the desired location and
use standard HTML tagging. This example adds text that appears above the
data types table in the generated report. Only the <dptemplate
name="LookupTable"> portion of the file is
shown.
<dptemplate name="LookupTable"> <hole id="Content">LUT_CONTENT</hole> <p><scan>This lookup table block contains the following data types:</scan></p> <hole id="LUTDataTypes">DATA_TYPE</hole> <hole id="FootNoteContent">LUT_FOOTNOTE_CONTENT</hole> </dptemplate>
Save the file.
At the MATLAB command line, zip the template folder into a template package.
For this example, the template package is zipped to the
CustomTemplate.htmtx
file.
zipTemplate("CustomTemplate");To use the saved template for your report, specify the template source in your report generator program.
lutable = LookupTable();
lutable.TemplateSrc = "CustomTemplate";Create a PDF report generator that specifies the plot height and width returned by the LookupTable reporter. This example uses the sf_car model and reports on its Torque ratio Lookup Table (n-D) block. This block is a 1-D lookup table and is in the transmission/Torque Converter subsystem of the sf_car model. To set the height and width of the plot, use the PlotReporter property.
import slreportgen.report.*
import mlreportgen.report.*

model_name = "sf_car";
load_system(model_name);
lutable = "sf_car/transmission/Torque Converter/Torque ratio";

rpt = slreportgen.report.Report("output","pdf");
chapter = Chapter(lutable);

rptr = LookupTable(lutable);
rptr.IncludeTable = false;
add(chapter,rptr);

rptr_resized = LookupTable(lutable);
rptr_resized.IncludeTable = false;
rptr_resized.PlotReporter.Snapshot.Width = "3in";
rptr_resized.PlotReporter.Snapshot.Height = "4in";
add(chapter,rptr_resized);

add(rpt,chapter);

close(rpt) ;
close_system(model_name)
rptview(rpt);
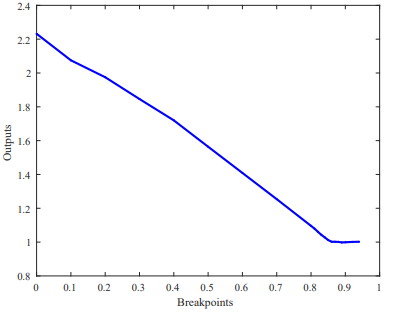
The default plot on the first page of the report uses predefined sizing to fit the plot to the page size.
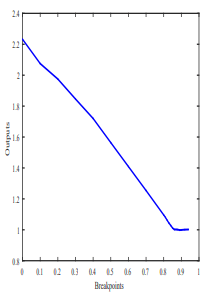
The resized plot on the second page of the report uses the specified 3" width and 4" height.
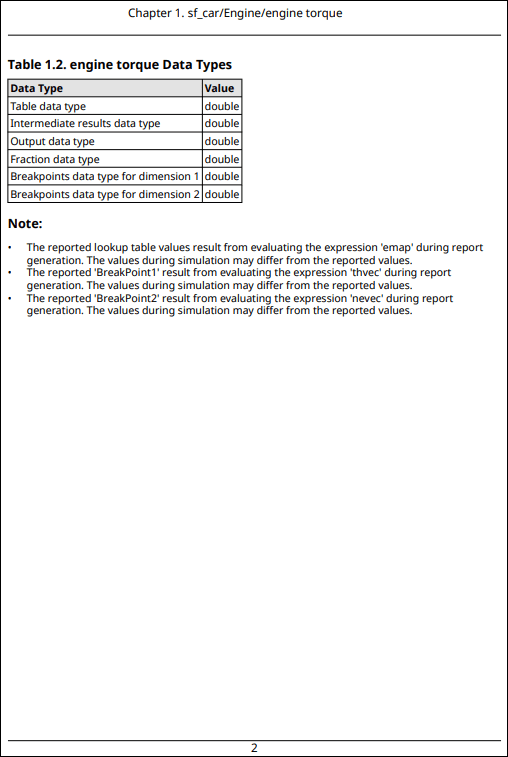
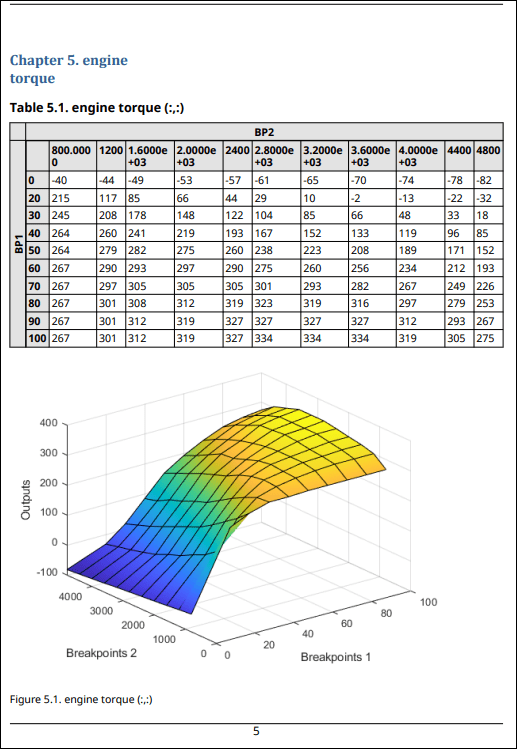
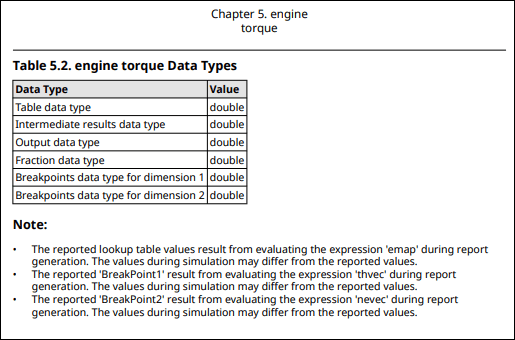
Create a PDF report generator that reports on a lookup table block. This example uses the sf_car model and reports on its engine torque Lookup Table (n-D) block. This block is a 2-D lookup table. The engine torque block is in the Engine subsystem of the sf_car model. The report, by default, includes a table of output values versus breakpoints, a surface plot, a table of block data types, and notes about possible differences between reported values and values obtained from simulation.
import slreportgen.report.*
import mlreportgen.report.*

model_name = "sf_car";
load_system(model_name);
lutable = "sf_car/Engine/engine torque";

rpt = slreportgen.report.Report('output','pdf');
chapter = Chapter(lutable);
rptr = LookupTable(lutable);
add(chapter,rptr);
add(rpt,chapter);

close(rpt);
close_system(model_name);
rptview(rpt)

This example shows how to create a PDF report generator that finds the blocks in the Engine subsystem of the sf_car model. The report generator program then loops through the blocks, identifies lookup table blocks, and uses the LookupTable reporter to report information on those blocks. For other blocks, the generated report reports on block properties by using the BlockFinder class.
import slreportgen.report.*
import slreportgen.finder.*
import mlreportgen.report.*

model_name = "sf_car";
load_system(model_name)
subsys_name = "sf_car/Engine";
rpt = Report;

blkfinder = BlockFinder(subsys_name);
blks = find(blkfinder);

for i=1:length(blks)
   if slreportgen.utils.isLookupTable(blks(i).Object)
      rptr = LookupTable(blks(i).Object);
      ch = Chapter(blks(i).Name);
      add(ch,rptr);
      add(rpt,ch);
   else
      ch = Chapter(blks(i).Name);
      add(ch,blks(i));
      add(rpt,ch);
   end
end

close(rpt);
rptview(rpt);
close_system(model_name);
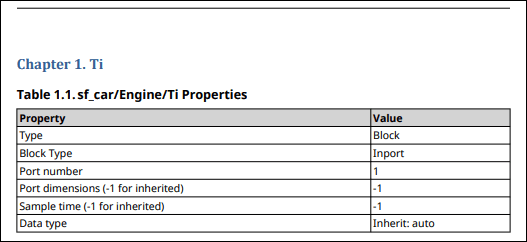
The first chapter shows the parameters for the Inport block.
The fifth chapter shows the output for a Lookup Table block reporter. The default output is a table of output values versus breakpoints, a plot, and a table of data types.
Version History
Introduced in R2018a