Main Content

MIMO Stabilization Diagram

Compute the frequency-response functions for a two-input/two-output system excited by random noise.

Load the data file. Compute the frequency-response functions using a 5000-sample Hann window and 50% overlap between adjoining data segments. Specify that the output measurements are displacements.

load modaldata
wl = 5000;

[frf,f] = modalfrf(Xrand,Yrand,fs,hann(wl),wl/2,Sensor="dis");

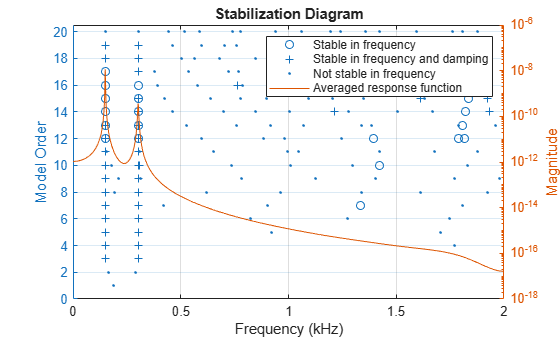
Generate a stabilization diagram to identify up to 20 physical modes.

modalsd(frf,f,fs,MaxModes=20)

Figure contains an axes object. The axes object with title Stabilization Diagram, xlabel Frequency (kHz), ylabel Model Order contains 4 objects of type line. One or more of the lines displays its values using only markers These objects represent Stable in frequency, Stable in frequency and damping, Not stable in frequency, Averaged response function.

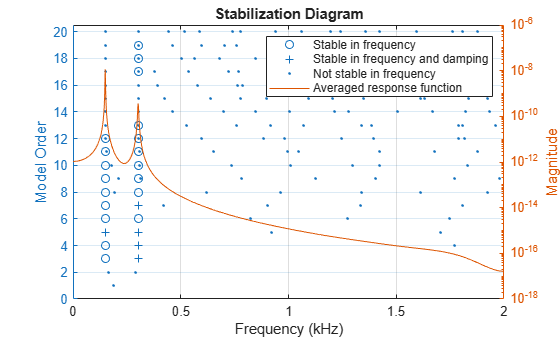
Repeat the computation, but now tighten the criteria for stability. Classify a given pole as stable in frequency if its natural frequency changes by less than 0.01% as the model order increases. Classify a given pole as stable in damping if the damping ratio estimate changes by less than 0.2% as the model order increases.

modalsd(frf,f,fs,MaxModes=20,SCriteria=[1e-4 0.002])

Figure contains an axes object. The axes object with title Stabilization Diagram, xlabel Frequency (kHz), ylabel Model Order contains 4 objects of type line. One or more of the lines displays its values using only markers These objects represent Stable in frequency, Stable in frequency and damping, Not stable in frequency, Averaged response function.

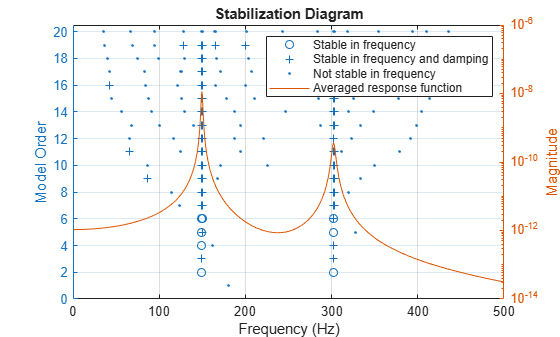
Restrict the frequency range to between 0 and 500 Hz. Relax the stability criteria to 0.5% for frequency and 10% for damping.

modalsd(frf,f,fs,MaxModes=20,SCriteria=[5e-3 0.1],FreqRange=[0 500])

Figure contains an axes object. The axes object with title Stabilization Diagram, xlabel Frequency (Hz), ylabel Model Order contains 4 objects of type line. One or more of the lines displays its values using only markers These objects represent Stable in frequency, Stable in frequency and damping, Not stable in frequency, Averaged response function.

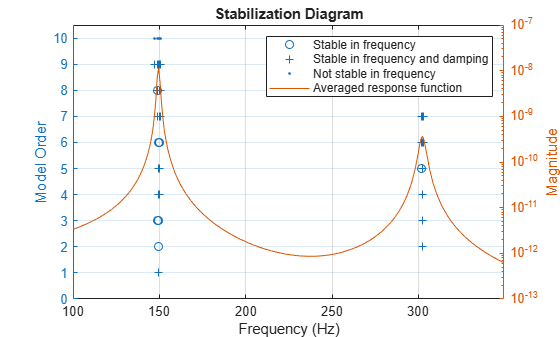
Repeat the computation using the least-squares rational function algorithm. Restrict the frequency range from 100 Hz to 350 Hz and identify up to 10 physical modes.

modalsd(frf,f,fs,MaxModes=10,FreqRange=[100 350],FitMethod="lsrf")

Figure contains an axes object. The axes object with title Stabilization Diagram, xlabel Frequency (Hz), ylabel Model Order contains 4 objects of type line. One or more of the lines displays its values using only markers These objects represent Stable in frequency, Stable in frequency and damping, Not stable in frequency, Averaged response function.

See Also

| |

Topics