Remove Trends from Data
R2026bMeasured signals can show overall patterns that are not intrinsic to the data. These trends can sometimes hinder the data analysis and must be removed.
Consider two electrocardiogram (ECG) signals with different trends. ECG signals are sensitive to disturbances such as power source interference. Load the signals and plot them.
load("ecgSignals.mat")
t = (1:length(ecgl))';

tiledlayout("flow")
nexttile
plot(t,ecgl)
grid on
title("ECG Signals with Trends")
ylabel("Voltage (mV)")
nexttile
plot(t,ecgnl)
grid on
xlabel("Sample Number")
ylabel("Voltage (mV)")
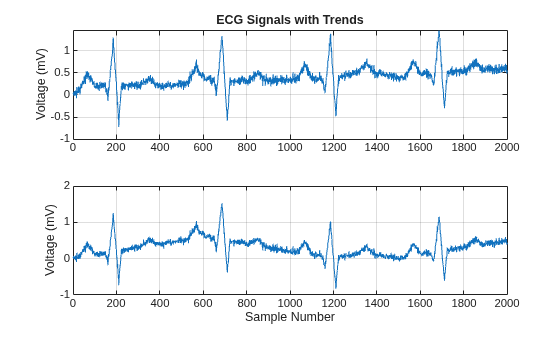
The signal on the first plot shows a linear trend. The trend on the second signal is nonlinear. To eliminate the linear trend, use the MATLAB® function detrend.
dt_ecgl = detrend(ecgl);
To eliminate the nonlinear trend, fit a low-order polynomial to the signal and subtract it. In this case, the polynomial is of order 6. Plot the two new signals.
opol = 6;
[p,s,mu] = polyfit(t,ecgnl,opol);
f_y = polyval(p,t,[],mu);

dt_ecgnl = ecgnl - f_y;

tiledlayout("flow")
nexttile
plot(t,dt_ecgl)
grid on
title("Detrended ECG Signals")
ylabel("Voltage (mV)")
nexttile
plot(t,dt_ecgnl)
grid on
xlabel("Sample Number")
ylabel("Voltage (mV)")
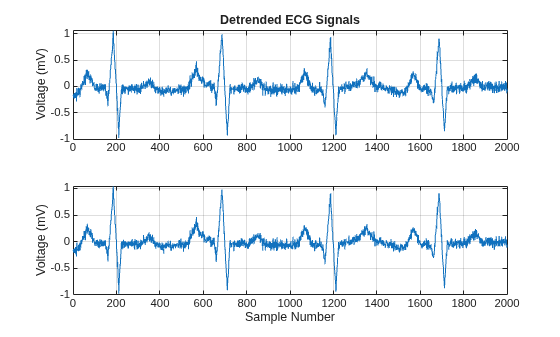
The trends have been effectively removed. Observe how the signals do not show a baseline shift anymore. They are ready for further processing.

