Compare Simulation Data
The Simulation Data Inspector can compare the data and metadata for runs and individual
signals you import from the workspace or a file or log in a simulation. You can analyze
comparison results using tolerances, and you can configure the comparison behavior by
specifying signal properties and comparison constraints. This example uses data logged from
simulations of the model slexAircraftExample and shows how to:
Compare signals and runs.
Analyze comparison results using the Compare pane in the Simulation Data Inspector.
Specify signal tolerances and global tolerances.
Configure comparison constraints.
For more information on tolerance calculations and signal properties that affect
comparisons, see How the Simulation Data Inspector Compares Data. To compare data programmatically, use the Simulink.sdi.compareRuns function or the Simulink.sdi.compareSignals function.
Setup
This example continues from Inspect Simulation Data. You can also use this script to generate the data required for the example.
mdl = "slexAircraftExample";
load_system(mdl)
Use the Simulink.sdi.markSignalForStreaming function to mark three signals for logging.
Simulink.sdi.markSignalForStreaming("slexAircraftExample/Pilot",1,"on")
Simulink.sdi.markSignalForStreaming("slexAircraftExample/Aircraft Dynamics Model",3,"on")
Simulink.sdi.markSignalForStreaming("slexAircraftExample/Aircraft Dynamics Model",4,"on")
To programmatically set the Wave form parameter of the Pilot block to sine, use the set_param function. Then, simulate the model.
set_param("slexAircraftExample/Pilot","WaveForm","sine")
sim(mdl);
Change the Wave form parameter of the Pilot to square. Simulate the model again.
set_param("slexAircraftExample/Pilot","WaveForm","square")
sim(mdl);
Compare Signals
You can compare signals to analyze the relationship between two signals in a model. For
example, compare the Stick input signal to the output signal,
alpha, rad.
Navigate to the Compare pane.
To view a list of signals available for comparison, expand the Baseline drop-down and select Signals.

Select
Stick (Run 1: slexAircraftExample).Expand the Compare to drop-down and select
alpha, rad (Run 1: slexAircraftExample).Click Compare.
Alternatively, you can select the Baseline and Compare to signals using the context menu by right-clicking the signal in the Inspect pane.
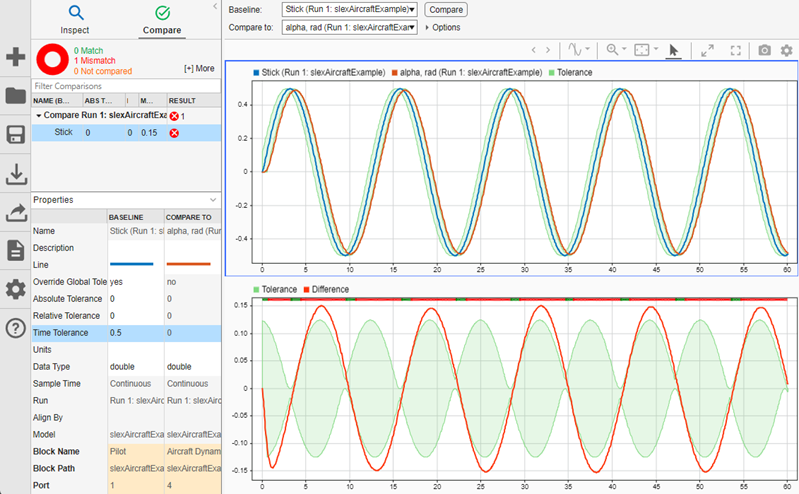
The signals are not identical, so they do not match within the absolute, relative, and
time tolerances, all set to 0 by default.

Signal Time Tolerance
Looking at the top plot in the comparison view, you can see the alpha,
rad signal lags the Stick signal. For signal comparisons,
the Simulation Data Inspector uses tolerance values specified for the
Baseline signal. Add a time tolerance to the
Stick signal to account for the lag.
Select the Stick signal and enter 0.5 in the
Time Tolerance field of the Properties pane.
When you specify a tolerance for a Baseline signal, its
Override Global Tolerance field automatically changes to
yes. When you click away from the Time Tolerance
field, the comparison runs again, using the signal-level tolerance you specified. If you
want to use global tolerance values for the signal, click the Override Global
Tolerance field and select no from the drop-down.
The Simulation Data Inspector draws the tolerance band around the plotted Baseline signal and around the signed difference signal displayed in the bottom subplot. The bar along the top of the difference plot shows regions within tolerance and out of tolerance for the comparison in green and red.
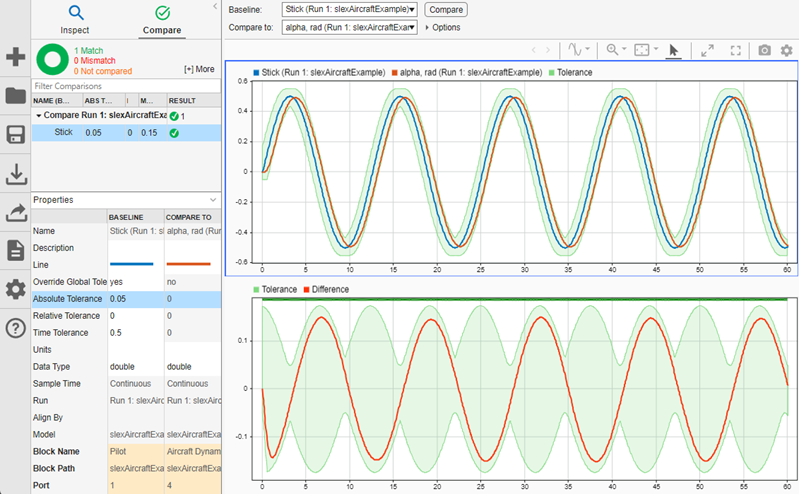
Signal Magnitude Tolerance
The time tolerance covers the phase difference between the two signals, but the comparison still includes regions out of tolerance due to the amplitude difference. You can add a magnitude tolerance as either an Absolute Tolerance or Relative Tolerance.
Note
The Simulation Data Inspector applies a magnitude tolerance only to comparisons of numeric signals and ignores the magnitude tolerance for any nonnumeric signal comparisons, such as those that contain enumerated or Boolean data.
To add an absolute tolerance to the Stick signal, enter
0.05 into the Absolute Tolerance field in the
properties pane. With the combination of the absolute and time tolerances, the signal
comparison passes.
Note
The Simulation Data Inspector draws the tolerance region using the most lenient interpretation of the specified tolerances for each point. For more information on how the Simulation Data Inspector calculates the tolerance band, see Tolerance Specification.
Compare Runs
You can also use the Simulation Data Inspector to compare all the signals in a run to all the signals in another run. Run comparisons can provide useful information about the effects of changing model parameters. For example, change the frequency cutoff of the filter for the control stick input signal. Then, evaluate the effect on the logged signals using the Simulation Data Inspector.
To access the data in the model workspace, on the Modeling tab of the
slexAircraftExamplemodel, under Design, click Model Explorer.Click the arrow next to the model name and select Model Workspace.
Change the value of
Tsfrom0.1to1and close the Model Explorer.Simulate the model with the new filter.
In the Compare pane in the Simulation Data Inspector, expand the Baseline drop-down, and select Runs.
From the list of runs, select
Run 2: slexAircraftExample.Expand the Compare to drop-down and select
Run 3: slexAircraftExample.Click Compare.
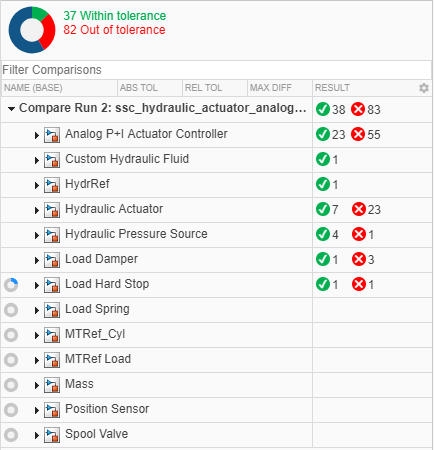
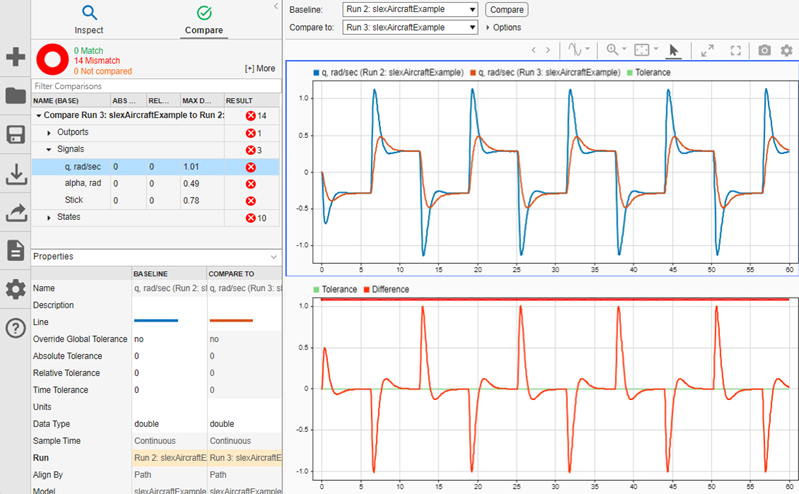
The Compare pane lists all signals from the compared runs and summarizes the results of the comparison in the Results column. In this example, all three signals aligned, and none matched. You can click More to see the reason each signal comparison did not match. All three signals are out of tolerance.
Note
The Simulation Data Inspector only compares signals from the
Baseline run that align with a signal from the Compare
To run. If a signal from the Baseline run does not
align with a signal from the Compare To run, the signal is listed
in the Compare pane with a warning. ![]() For more information on signal alignment, see Signal Alignment.
For more information on signal alignment, see Signal Alignment.
To plot a comparison result, select the signal you want to view in the
Compare pane. For example, select the result for the q,
rad/sec signal. The top plot shows the q, rad/sec signals
from the Baseline and Compare To runs. The bottom
plot shows the difference between the signals and the calculated tolerance band.
Global Tolerances
To analyze the signals in the run comparison, you can specify global tolerances. To
specify global tolerances, click Options. Under Global
Tolerances, enter 0.75 for the time tolerance and
0.075 for the absolute tolerance.

Before R2024b: Click More to access global tolerance and constraint options.
Click the Compare button to run the comparison. The Simulation
Data Inspector plots the tolerance band around the Baseline signal
and on the signed difference plot. With the new tolerance values, the
Stick and q, rad/sec signals pass the
comparison.

View the alpha, rad signal to analyze the out of tolerance regions
in the comparison result. Click the arrow buttons ![]() in the toolbar to navigate through the out of tolerance
regions. Two cursors on the plot show the beginning and end of the first out of tolerance
region. You can use your keyboard arrows to explore the signal and tolerance values
throughout each out of tolerance region. To view the next out of tolerance region, click
the right arrow button in the tool strip.
in the toolbar to navigate through the out of tolerance
regions. Two cursors on the plot show the beginning and end of the first out of tolerance
region. You can use your keyboard arrows to explore the signal and tolerance values
throughout each out of tolerance region. To view the next out of tolerance region, click
the right arrow button in the tool strip.

To resolve the out of tolerance regions, you can choose to modify the global tolerance
values or to add a signal-specific tolerance to the alpha, rad signal
using the signal properties.
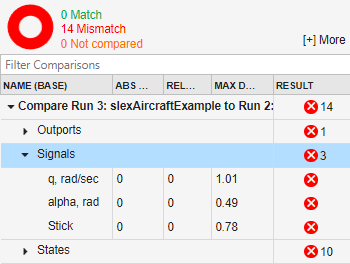
Configure Comparison Constraints
You can also apply constraints to comparisons that affect whether the result is a match or mismatch. For example, you can specify that the time vectors for signals must match in order for the result to be a match. To specify the constraint, click Options, then select Signal time vectors must match. To run a new comparison with this constraint, click Compare.
Before R2024b: Click More to access global tolerance and constraint options.
The comparison results show all signal results as mismatches now. The time vectors do not match for any of the signals because they were logged from simulations of a model that uses a variable-step solver, and the conditions changed between simulations. When the comparison result is a mismatch due to a constraint, the Simulation Data Inspector does not compute results for that signal. When you select a signal, the plot area shows an explanation of why the signal result is a mismatch.

You can configure these comparison constraints:
Signal data types must match
Signal start and stop times must match
Signal time vectors must match
When you require a match in signal metadata, specifying a constraint can return a mismatch result more quickly because the comparison does not compute results when the specified metadata does not match.
You can also configure a comparison to stop computing results after detecting the first mismatch result. When you configure a comparison to stop on the first mismatch, the comparison always stops after detecting the first mismatch in the signal metadata. You can also choose to stop the comparison when the first mismatch result is due to an out-of-tolerance result when comparing the signal data.
The Simulation Data Inspector always aligns signals in the baseline and comparison runs.
When you configure a comparison to stop on the first mismatch, signals that do not align and
signals with units that do not match always cause a comparison to stop. By default, the
Simulation Data Inspector also compares the units of aligned signals when both the baseline
and comparison signals have units. When you configure the comparison to stop on the first
mismatch, mismatched units stop the comparison. To ignore mismatches in signal units,
specify Units="Ignore". You can specify additional metadata for the
comparison to check by selecting one or more constraints.
Cancel Comparisons
The runs and signals used in this example are relatively small, and comparisons run quickly. When you compare long signals or runs containing many signals, comparisons may take more time. The Simulation Data Inspector displays incremental progress indicators during comparison, and the Compare button becomes a Cancel button you can click to cancel the comparison at any point. For hierarchical data, the Results column in the comparison view summarizes the results on each hierarchical node.