parallelcoords
Parallel coordinates plot
Description
parallelcoords( creates a parallel coordinates
plot of the multivariate data in the matrix x)x. Use a
parallel coordinates plot to visualize high-dimensional data, where each
observation is represented by the sequence of its coordinate values plotted
against their coordinate indices.
parallelcoords( creates
a parallel coordinates plot with additional options specified by one
or more x,Name,Value)Name,Value pair arguments. For example,
you can standardize the data in x or label the
coordinate tick marks along the horizontal axis of the plot.
parallelcoords( creates
a parallel coordinates plot using the axes specified by the axes graphic
object ax,___)ax, using any of the previous syntaxes.
Examples
Load the Fisher iris sample data.
load fisheririsThe data contains four measurements (sepal length, sepal width, petal length, and petal width) from three species of iris flowers. The matrix meas contains all four measurements for each of 150 flowers. The cell array species contains the species name for each of the 150 flowers.
Create a cell array that contains the name of each measurement variable in the sample data.
labels = {'Sepal Length','Sepal Width','Petal Length','Petal Width'};Create a parallel coordinate plot using the measurement data in meas. Use a different color for each group as identified in species, and label the horizontal axis using the variable names.
parallelcoords(meas,'Group',species,'Labels',labels)

The resulting plot contains one line for each observation (flower). The color of each line indicates the flower species.
Load the Fisher iris sample data.
load fisheririsThe data contains four measurements (sepal length, sepal width, petal length, and petal width) from three species of iris flowers. The matrix meas contains all four measurements for each of 150 flowers. The cell array species contains the species name for each of the 150 flowers.
Create a cell array that contains the name of each measurement variable in the sample data.
labels = {'Sepal Length','Sepal Width','Petal Length','Petal Width'};Create a parallel coordinates plot using the measurement data in meas. Plot only the median, 25 percent, and 75 percent quartile values for each group identified in species. Label the horizontal axis using the variable names.
parallelcoords(meas,'group',species,'labels',labels,...
               'quantile',.25)
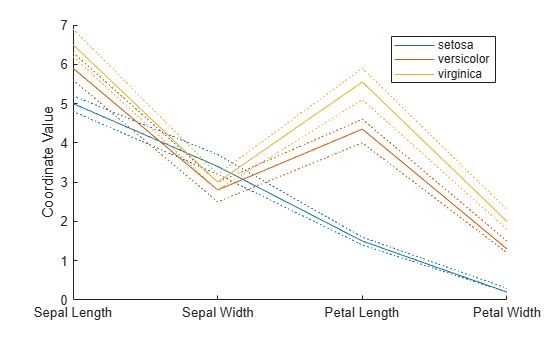
The plot shows the median values for each group as a solid line and the quartile values as dotted lines of the same color. For example, the solid blue line shows the median value measured for each variable on setosa irises. The dotted blue line below the solid blue line shows the 25th percentile of measurements for each variable on setosa irises. The dotted blue line above the solid blue line shows the 75th percentile of measurements for each variable on setosa irises.
Load the Fisher iris sample data.
load fisheririsThe data contains four measurements (sepal length, sepal width, petal length, and petal width) from three species of iris flowers. The matrix meas contains all four measurements for each of 150 flowers. The cell array species contains the species name for each of the 150 flowers.
Create a cell array that contains the name of each measurement variable in the sample data.
labels = {'Sepal Length','Sepal Width','Petal Length','Petal Width'};Create a parallel coordinates plot using the measurement data in meas. Plot only the median, 25 percent, and 75 percent quartile values for each group identified in species. Label the horizontal axis using the variable names. Set the line width to 2.
parallelcoords(meas,'group',species,'labels',labels,...
               'quantile',.25,'LineWidth',2)
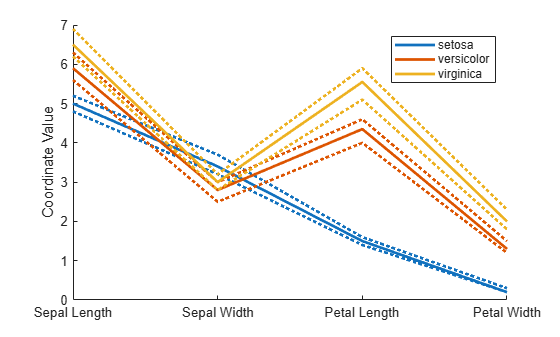
Specifying 'LineWidth' in this way sets the width of every line in the plot to 2.
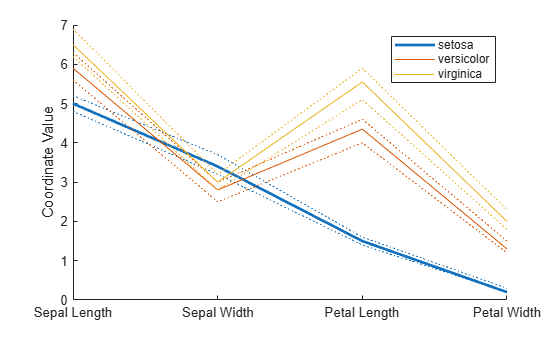
Recreate the parallel coordinates plot, but this time, use handles to increase the width of only the line representing the median value for each measurement made on irises in the setosa group.
h = parallelcoords(meas,'group',species,'labels',labels,...
               'quantile',.25)

h =
  9×1 Line array:

  Line    (median)
  Line    (lower quantile)
  Line    (upper quantile)
  Line    (median)
  Line    (lower quantile)
  Line    (upper quantile)
  Line    (median)
  Line    (lower quantile)
  Line    (upper quantile)
The returned column vector h contains handles that correspond to each line object created by parallelcoords. For example, h(1) corresponds to the median line for the first grouping variable (setosa).
Use dot notation to increase the width of the line showing the median value for each measurement made on irises in the setosa group.
h(1).LineWidth = 2;
Input Arguments
Name-Value Arguments
Output Arguments
Alternative Functionality
Alternatively, you can create a ParallelCoordinatesPlot object by
using the parallelplot function.
Unlike the
parallelcoordsfunction,parallelplotallows you to plot tabular data that includes categorical variables.parallelplotdoes not support the plotting of quantiles for numeric data. However, theParallelCoordinatesPlotobject contains theDataNormalizationproperty, which provides several data normalization methods for coordinates with numeric values.
To control the appearance and behavior of the object, change the ParallelCoordinatesPlot Properties.
Version History
Introduced before R2006a