Visualizing Wavelets, Wavelet Packets, and Wavelet Filters
This example shows how to use wfilters, wavefun, and wpfun to obtain the filters, wavelet, or wavelet packets corresponding to a particular wavelet family. You can visualize 2-D separable wavelets with wavefun2.
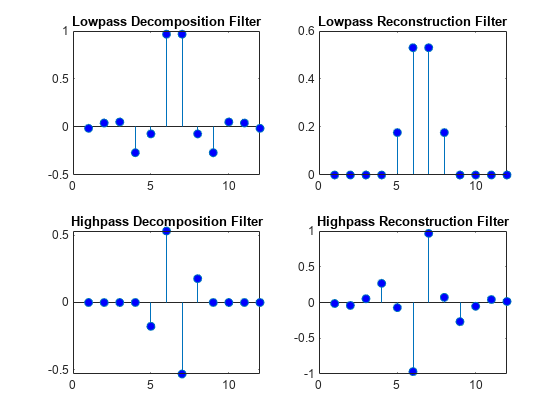
Obtain the decomposition (analysis) and reconstruction (synthesis) filters for the biorthogonal spline wavelet filters with 3 vanishing moments in the reconstruction filter and 5 vanishing moments in the decomposition filter.
[LoD,HiD,LoR,HiR] = wfilters('bior3.5');
subplot(2,2,1)
stem(LoD,'markerfacecolor',[0 0 1]); title('Lowpass Decomposition Filter');
subplot(2,2,2)
stem(LoR,'markerfacecolor',[0 0 1]); title('Lowpass Reconstruction Filter');
subplot(2,2,3)
stem(HiD,'markerfacecolor',[0 0 1]); title('Highpass Decomposition Filter');
subplot(2,2,4)
stem(HiR,'markerfacecolor',[0 0 1]); title('Highpass Reconstruction Filter');

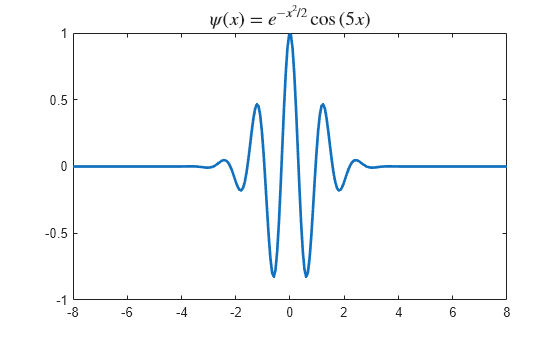
Visualize the real-valued Morlet wavelet. There is no associated scaling function.
figure
[psi,xval] = wavefun('morl');
plot(xval,psi,'linewidth',2)
title('$\psi(x) = e^{-x^2/2} \cos{(5x)}$','Interpreter','latex',...
     'fontsize',14);

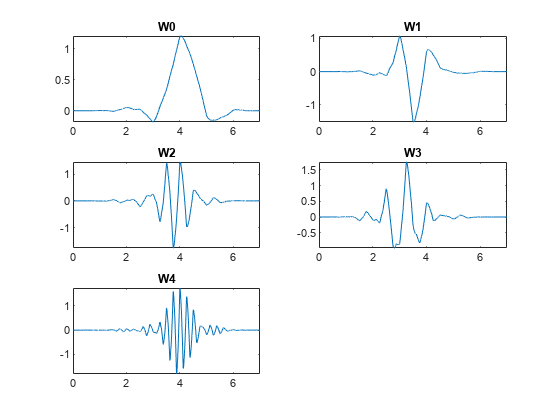
Obtain the first 4 wavelet packets for the Daubechies least-asymmetric wavelet with 4 vanishing moments, sym4.
[wpws,x] = wpfun('sym4',4,10);
for nn = 1:size(wpws,1)
    subplot(3,2,nn)
    plot(x,wpws(nn,:))
    axis tight
    title(['W',num2str(nn-1)]);
end
