how to plot slice graph from several png files
Show older comments
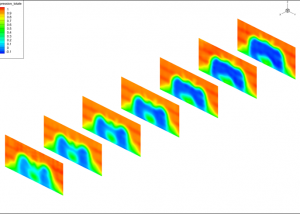
Hello Everybody I have several png files that show displacement varying with time, for a nice visualization I thought that making a slice graph could be a nice idea, I didn't find any example helping me, I would appreciate any help.Thank you
3 Comments
jonas
on 8 Jul 2018
Difficult to help unless you provide more information. For example, upload example images and describe your desired output in better detail.
Samaneh Arzpeima
on 9 Jul 2018
Samaneh Arzpeima
on 9 Jul 2018
Answers (1)
[X,Y,C] = peaks(100) ;
N = 10 ;
Z = ones(size(X)) ;
figure
hold on
for i = 1:N
surf(Z+i,X,Y,C)
end
Rotate for better view.
1 Comment
Samaneh Arzpeima
on 9 Jul 2018
Categories
Find more on 2-D and 3-D Plots in Help Center and File Exchange
on 8 Jul 2018
on 9 Jul 2018
Community Treasure Hunt
Find the treasures in MATLAB Central and discover how the community can help you!
Start Hunting!