Extracting points from a matrix tangential to a centreline
Show older comments
Hello,
I have a tube with two branches (please see attached point cloud showing this model where the columns are x y z and a variable respectively). I also have a centreline that runs through the main branch of the model. Please also see attached centreline points where the columns are x y z respectively. I have also attached images showing the model and centreline. The red outline drawn on the model geometry highlights where the main branch is located.
At each centreline point I am trying to extract the points located tangentially along the model to that centreline point to a new matrix along with their corresponding variable value. I have attached two images that hopefully clarify better what I want to achieve. I am pretty new to Matlab so in depth explanations would be great.
Thanks in advance.
6 Comments
darova
on 13 Mar 2020
The best idea i have: check each point of centerline (red) with data

ix = (xdata-xc(i)).^2 + (ydata-(yc(i)).^2 < R.^2; % indices inside circle
HB
on 14 Mar 2020
darova
on 14 Mar 2020
What are these?

HB
on 15 Mar 2020
darova
on 15 Mar 2020
Maybe better be to use pdist2. IT calculates every possible combination of distances
You have two set of data (46 and 113502). So it creates matrix of size 46x11502
Try this
D = pdist2([CLx CLy CLz],[geomx geomy geomz]); % matrix of size 46x113502
D1 = D < 2; % distances smaller than "2" (matrix "0" and "1")
[~,ix] = find(sum(D1)>0); % if columns has one "1" - find it
plot3(CLx,CLy,CLz,'r') % centerline
hold on
plot3(geomx,geomy,geomz,'.b') % all data
plot3(geomx(ix),geomy(ix),geomz(ix),'.r') % data close to centerline
hold off
Answers (2)
darova
on 16 Mar 2020
0 votes
Here is what i did
I moved data to origin and rotated at some points of centerline
Once centerline is vertical i extract data -1<z<1 (for example)

I created surface at some points of centerline
countour was used to get crossection


Result

See attached script
3 Comments
HB
on 17 Mar 2020
darova
on 17 Mar 2020
To write data
DATA = [];
for i = 1...
% code
V(:,1) = [];
DATA = [DATA V'];
end
dlmwrite('myFile.txt',DATA,'delimiter','\t')
- and their corresponding variable value which are located in geom_variable(1:1:end,4)?
Im afraid crossection line doesn't have corresponding values of geom_variable.

Closest points/values (red) can be found. But it's always different number
Change these lines in a loop
ix = abs(V(3,:)) < 0.1; % data for crossection creating
length(find(ix))
darova
on 17 Mar 2020

30 Comments
darova
on 17 Mar 2020
This line means the number of points
length(find(ix))
Once the number of points is different (very simple scheme)
cross1 cross2 cross3 ...
1 2 1
5 4 2
3 2
5
How do you want to have points? Separate txt?
HB
on 18 Mar 2020
darova
on 18 Mar 2020
this should work
ix = abs(V(3,:)) < 0.5; % data for crossection creating
dlmwrite([num2str(i) '.txt'],V(:,ix)','delimiter','\t')
HB
on 18 Mar 2020
darova
on 18 Mar 2020
Put those lines inside for loop

Change height of crossection to grab more points


darova
on 16 Apr 2020
You should have a few files (separate crossection). Do you have them?
darova
on 16 Apr 2020
Sorry. I made a mistake
Try this script
HB
on 16 Apr 2020
darova
on 16 Apr 2020
There are no 'corresponding' values

They can be interpolated
See script
HB
on 18 Apr 2020
darova
on 18 Apr 2020
The data looks strange. Maybe units?

darova
on 18 Apr 2020
I scaled (100x) geometry. Just a few similar points

HB
on 28 Apr 2020
darova
on 28 Apr 2020
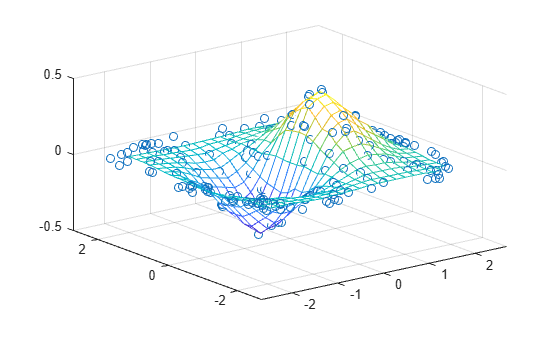
Imagine this is your data (x,y,z and c - some value - color)

Your data is like cylinder. I usually use interp2 or griddata for interpolation. Your data should like this (for each X Y only one Z)
So to make your data more 'flat' i unwided it (don't know if it's correct word). Look - > 
[t0,r0] = cart2pol(x0,y0); % convert data from cartesian to polar

R = griddata(t0,z0,r0,T,Z); % calculate radius for grid points
C = griddata(t0,z0,c0,T,Z); % calculate color for grid points
[X,Y] = pol2cart(T,R); % convert back to cartesian


Thank you, that's a great explanation!
I was actually trying the script on a some other cases, and for some reason on a few of them points of the cross section line are missing as seen in image below. I don't know if there is something that can be modified in the script to fix this? I have attached the files FYI. Thanks!

darova
on 4 May 2020
Is it acceptable?


HB
on 4 May 2020
darova
on 4 May 2020
My bad. griddata has some problem at the boundaries. scatteredInterpolant uses extrapolation
I changed these lines
F = scatteredInterpolant(t(:),5*gz1(:),gc(ix));
gc1 = F(ct,ct*0);
HB
on 7 May 2020
darova
on 7 May 2020
Sure, look on this picture

As i understood correctly: the script calculates red distance and if it's small enough the point is taken
You can calculate green distance too and compare it
d2 = pdist2(geomp(igeomp,1:3), CLp(iCLp,1:3)); % green distance
if dtmp<dist && d2 < 5 % compare red and green distance
Is it that you wanted?
darova
on 7 May 2020
- So I think as well as the red distance it also calculated distances to the wall somehow.
It doesn't that's why second branch is taken. I changed your script a bit
HB
on 8 May 2020
darova
on 8 May 2020
Don't see any gap

HB
on 8 May 2020

darova
on 8 Jul 2020
Hello!
I think the problem you described is cause by radius you choosed. You didn't found all the points of an arteria
ix = sum(D<2) > 0; % if columns has one "1" - find it

You arteria is thicker than you think. Try to increase the radius
ix = sum(D<2.5) > 0; % if columns has one "1" - find it

Categories
Find more on Matrix Indexing in Help Center and File Exchange
on 8 Jul 2020
Community Treasure Hunt
Find the treasures in MATLAB Central and discover how the community can help you!
Start Hunting!