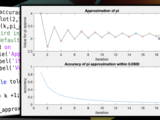
Plot a function (approximation of pi) in MATLAB
Version 1.0.0 (2.15 KB) by
Dr. Kelsey Joy
computational model, visualization, starting to build a simulation, plotting functions (plot, subplot, text, xlabel, ylabel)
This code is explained in the following YouTube Video:
For more of my YouTube Videos, check out my MATLAB tutorial playlist: https://youtube.com/playlist?list=PLmB_c16LoAcWz_5qK1XpBlP0DiD6cgU-r
Also subscribe to my channel (Engineering with Dr. Kelsey Joy): https://www.youtube.com/c/EngineeringwithDrKelseyJoy
Cite As
Dr. Kelsey Joy (2026). Plot a function (approximation of pi) in MATLAB (https://www.mathworks.com/matlabcentral/fileexchange/104315-plot-a-function-approximation-of-pi-in-matlab), MATLAB Central File Exchange. Retrieved .
MATLAB Release Compatibility
Created with
R2021b
Compatible with any release
Platform Compatibility
Windows macOS LinuxTags
Acknowledgements
Inspired by: Approximation of Pi (Leibniz formula)
Discover Live Editor
Create scripts with code, output, and formatted text in a single executable document.
| Version | Published | Release Notes | |
|---|---|---|---|
| 1.0.0 |

