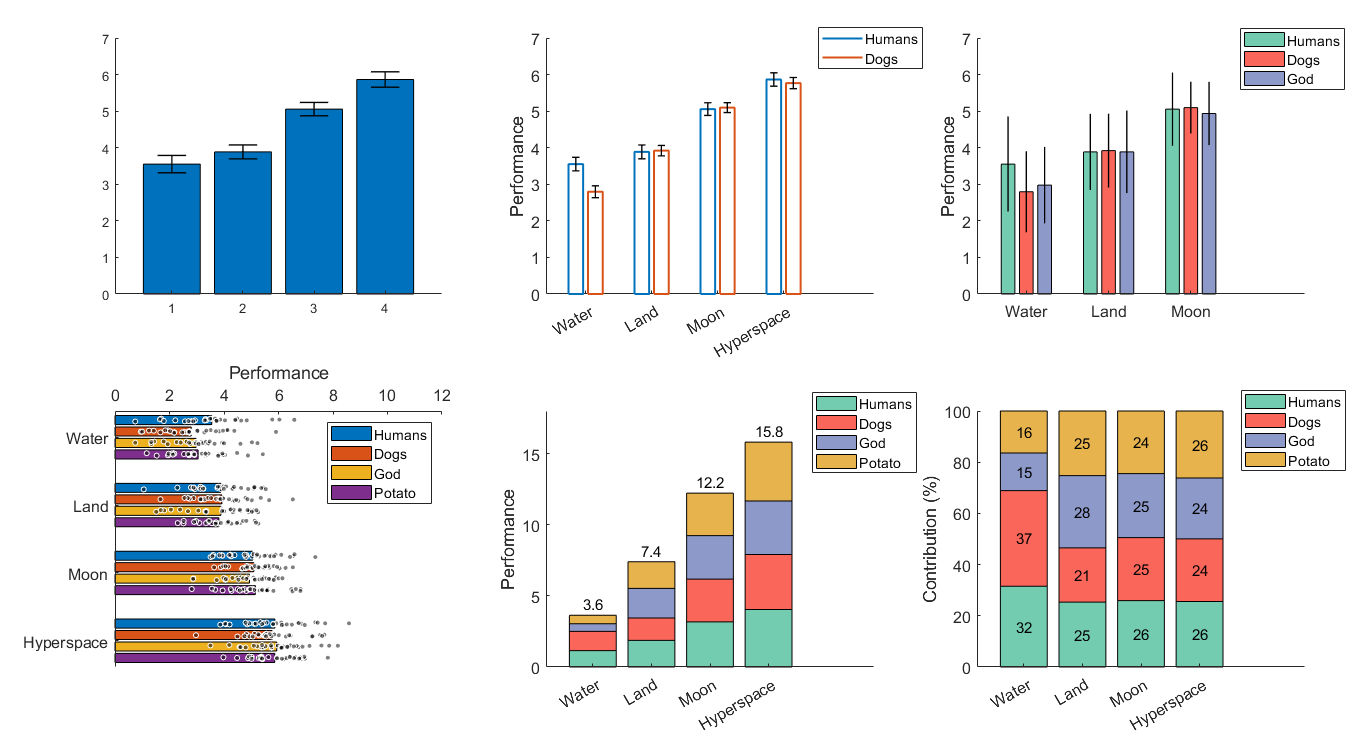
dabarplot - beautiful grouped and stacked bar plots
Bar plots for multiple conditions and groups (part of a larger toolbox for 2-level factorial data)

You are now following this Submission
- You will see updates in your followed content feed
- You may receive emails, depending on your communication preferences
Editor's Note: This file was selected as MATLAB Central Pick of the Week
Cite As
Povilas Karvelis (2026). dabarplot - beautiful grouped and stacked bar plots (https://github.com/povilaskarvelis/DataViz/releases/tag/v3.2.4), GitHub. Retrieved .
General Information
- Version 3.2.4 (918 KB)
-
 View License on GitHub
MATLAB Release Compatibility
- Compatible with any release
Platform Compatibility
- Windows
- macOS
- Linux
| Version | Published | Release Notes | Action |
|---|---|---|---|
| 3.2.4 | See release notes for this release on GitHub: https://github.com/povilaskarvelis/DataViz/releases/tag/v3.2.4 |
||
| 3.2.3 | See release notes for this release on GitHub: https://github.com/frank-pk/DataViz/releases/tag/v3.2.3 |
||
| 3.2.2 | See release notes for this release on GitHub: https://github.com/frank-pk/DataViz/releases/tag/v3.2.2 |
||
| 3.2.1 | See release notes for this release on GitHub: https://github.com/frank-pk/DataViz/releases/tag/v3.2.1 |
||
| 3.1.0 |

