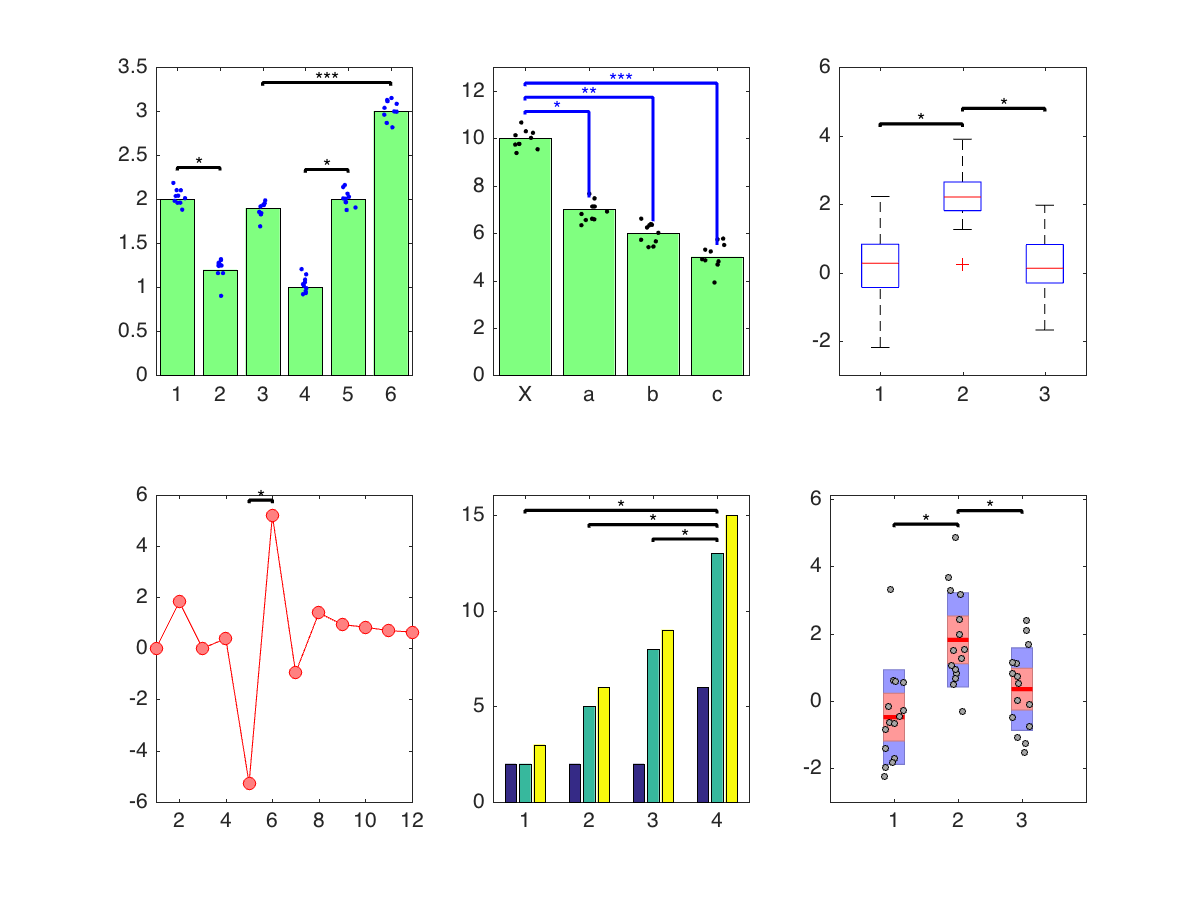
raacampbell/sigstar
Add significance bars and asterisks to various plot types

You are now following this Submission
- You will see updates in your followed content feed
- You may receive emails, depending on your communication preferences
Cite As
Rob Campbell (2026). raacampbell/sigstar (https://github.com/raacampbell/sigstar), GitHub. Retrieved .
General Information
- Version 1.76.0 (8.27 KB)
-
 View License on GitHub
MATLAB Release Compatibility
- Compatible with any release
Platform Compatibility
- Windows
- macOS
- Linux
| Version | Published | Release Notes | Action |
|---|---|---|---|
| 1.76.0 | add citation |
||
| 1.41.0 | typo |
||
| 1.4.0 | change description |
||
| 1.3.0 | Update code to no longer call the range function, which is part of the stats toolbox. |
||
| 1.2.0 | Update to work with grouped error bars. |
||
| 1.1.0 | Add the ability to label data as being not significantly different. Example 2 in the function's help text shows how to do this. |
||
| 1.0.0 |
To view or report issues in this GitHub add-on, visit the GitHub Repository.
To view or report issues in this GitHub add-on, visit the GitHub Repository.

