
You are now following this Submission
- You will see updates in your followed content feed
- You may receive emails, depending on your communication preferences
Editor's Note: This file was selected as MATLAB Central Pick of the Week
Cite As
milan batista (2026). fitVirus (https://www.mathworks.com/matlabcentral/fileexchange/74411-fitvirus), MATLAB Central File Exchange. Retrieved .
Acknowledgements
Inspired: Coronavirus Tracker - Country Modeling
General Information
- Version 2.1.2 (3.61 MB)
MATLAB Release Compatibility
- Compatible with any release
Platform Compatibility
- Windows
- macOS
- Linux
| Version | Published | Release Notes | Action |
|---|---|---|---|
| 2.1.2 | Change image |
||
| 2.1.1 | Add RMSE to the graph. Update data. |
||
| 2.1.0 | Change the graph layout. Update data. |
||
| 2.0.25 | Suppress invalid forecasting when the actual number of cases is greater than actual |
||
| 2.0.24 | Correct description |
||
| 2.0.23 | Add data source |
||
| 2.0.22 | Add data for Denmark, Hungary, Norway, NY State |
||
| 2.0.21 | Improve initial guess. Add data for Belgium, Croatia, UK. Upgrades data for the Netherlands (thanks to Rolf Boelens) |
||
| 2.0.20 | add note about fitVirusCOVID19 program |
||
| 2.0.19 | Correct link to new version |
||
| 2.0.18 | Correct iniGuess (thanks to Nikolas Wernecke). Actual daily cases are added to the graph. R2 for total cases and infection rates are added to the summary. Data for Portugal are included. |
||
| 2.0.17 | Add note about a new version of the program (thanks to Joshua McGee) |
||
| 2.0.16 | Update requirements |
||
| 2.0.15 | Data and scripts for the Netherlands and USA added (thanks to Rolf Boelens) |
||
| 2.0.14 | Update description |
||
| 2.0.13 | Add link to examples |
||
| 2.0.12 | Add data for Austria |
||
| 2.0.11 | Correct data |
||
| 2.0.10 | Update data. Add data for France, Switzerland |
||
| 2.0.9 | Change summary |
||
| 2.0.8 | add data for Spain |
||
| 2.0.7 | update description |
||
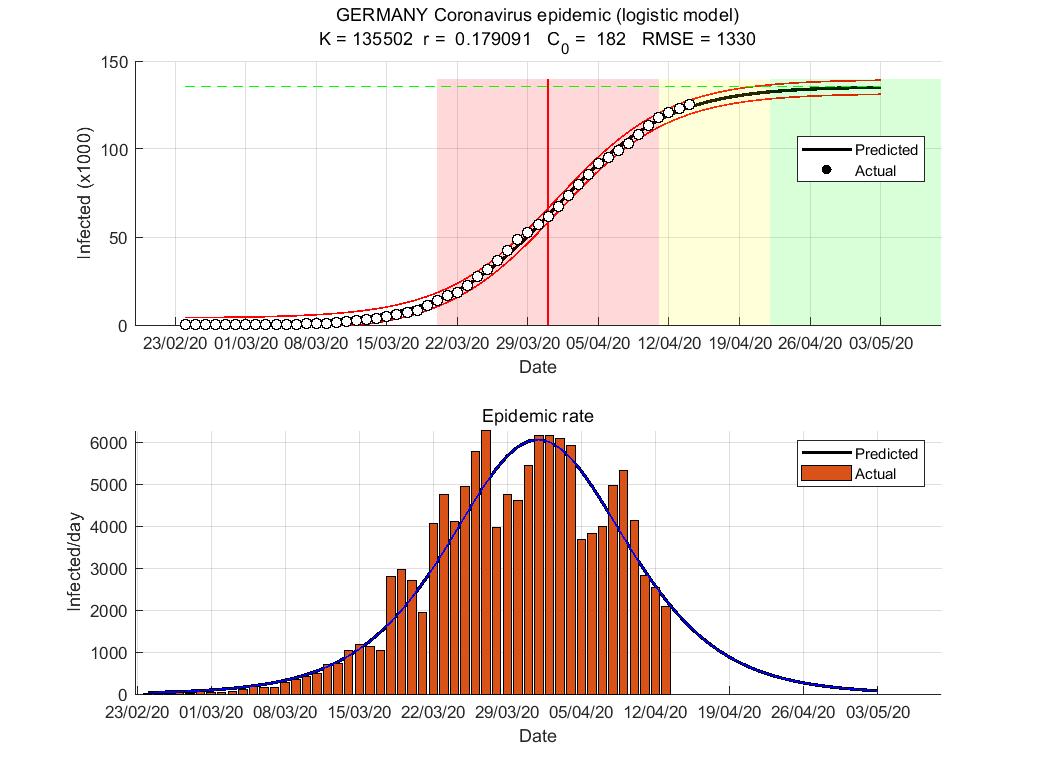
| 2.0.6 | add data for Germany |
||
| 2.0.5 | Update data. Add summary report to live scripts. |
||
| 2.0.4 | Remove the upper limit. |
||
| 2.0.3 | Update data. Minor changes. R2 is now included in the table. |
||
| 2.0.2 | Minor changes |
||
| 2.0.1 | Change imaga |
||
| 2.0.0 | Major revision. Remove Weibull regression, remove graph for peak time, combine graph for epidemy evaluation and its rate. Add epidemy duration and end date to report. Replace regressor A with C0. Add data for Slovenia. |
||
| 1.0.14 | Minor corrections |
||
| 1.0.13 | Add data for Iran and out of China. Weibull regression is now optional. |
||
| 1.0.12 | Add data up to 7.Mar.2020 |
||
| 1.0.11 | Correct data for South Korea |
||
| 1.0.10 | Add data for 5.Mar.2020 |
||
| 1.0.9 | Correct calculation of relative error of daily predictions |
||
| 1.0.8 | Add data for Italy |
||
| 1.0.7 | Correct description |
||
| 1.0.6 | Add data for 4.Mar.2020 |
||
| 1.0.5 | Correct description |
||
| 1.0.4 | Add data for 3 Mar 2020 |
||
| 1.0.3 | Update description |
||
| 1.0.2 | Update example |
||
| 1.0.1 | Add image |
||
| 1.0.0 |

