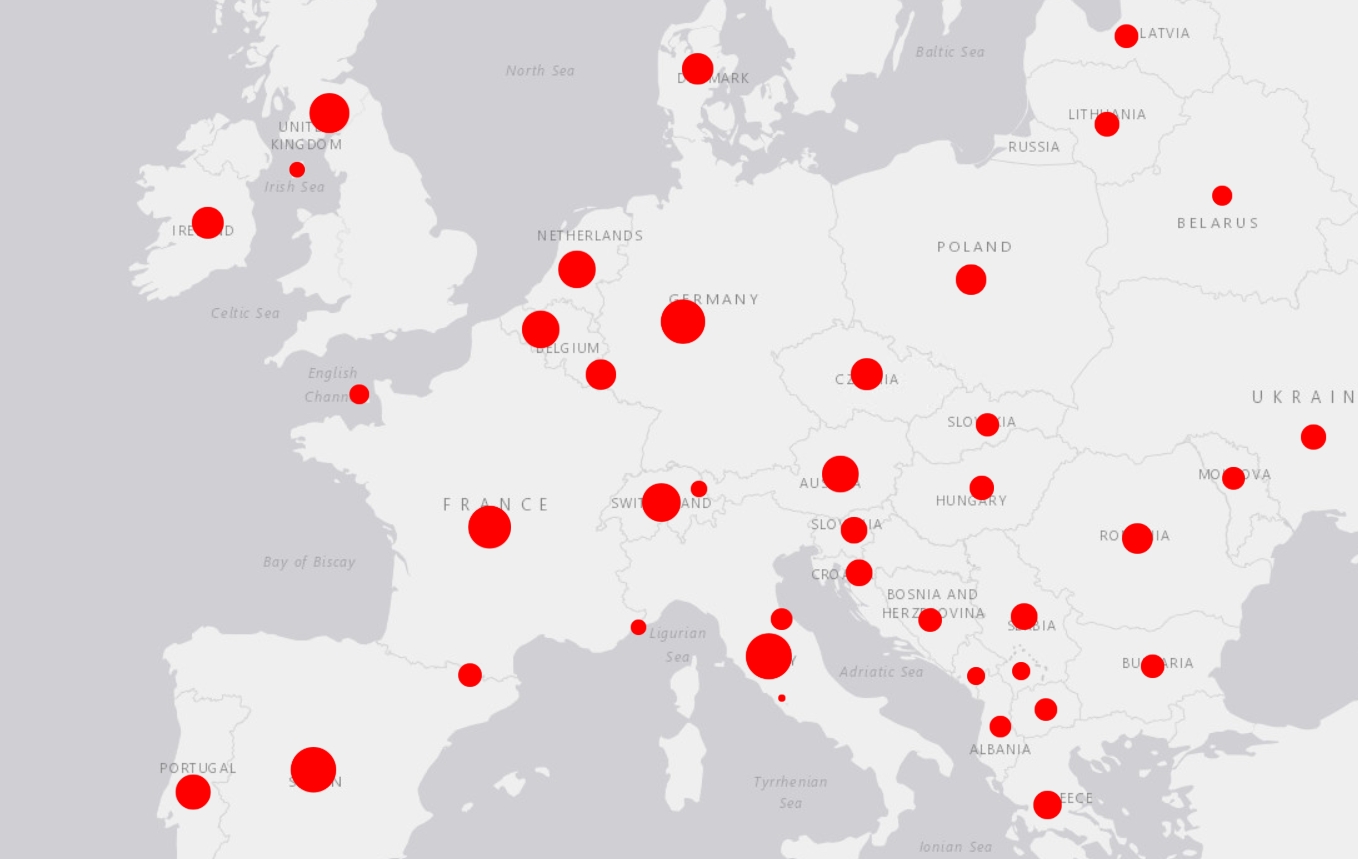
Reading and visualizing COVID-19 data
This live script reads data from the Johns Hopkins University dataset and then plots new COVID infected people vs all people infected.

You are now following this Submission
- You will see updates in your followed content feed
- You may receive emails, depending on your communication preferences
Cite As
Lajos Varga et al (2020). Analyzing COVID-19 data (https://www.mathworks.com/matlabcentral/fileexchange/74797), MATLAB Central File Exchange. Retrieved March 31, 2020.
General Information
- Version 1.0.6 (162 KB)
MATLAB Release Compatibility
- Compatible with any release
Platform Compatibility
- Windows
- macOS
- Linux
| Version | Published | Release Notes | Action |
|---|---|---|---|
| 1.0.6 | Added list of contributors |
||
| 1.0.5 | Updated description with list of features |
||
| 1.0.4 | Live script fine tuning |
||
| 1.0.3 | Description update |
||
| 1.0.2 | Updated cover image |
||
| 1.0.1 | Description text updated |
||
| 1.0.0 |

